這是我們測試的第二張 NVIDIA GeForce RTX 4070 Ti 顯示卡。
TUF Gaming GeForce RTX 4070 Ti 採用 Ada Lovelace 架構的 GeForce RTX 4070 Ti 擁有 NVIDIA 3rd Gen RT Cores 與 4th Gen Tensor Cores,除了 2 倍 Ray Tracing 效能表現提升外,同時有透過 DLSS 3 提供更佳的遊戲體驗。
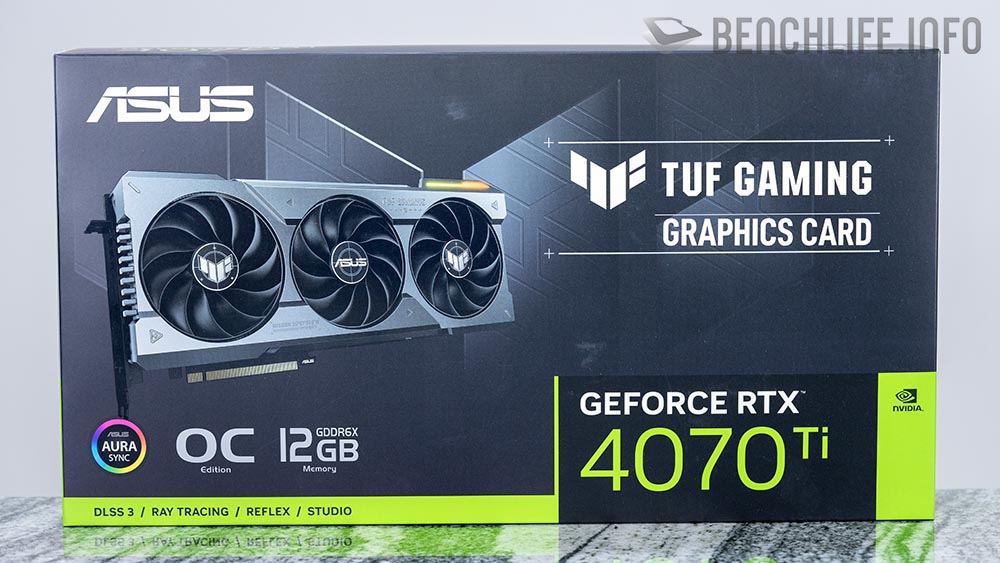
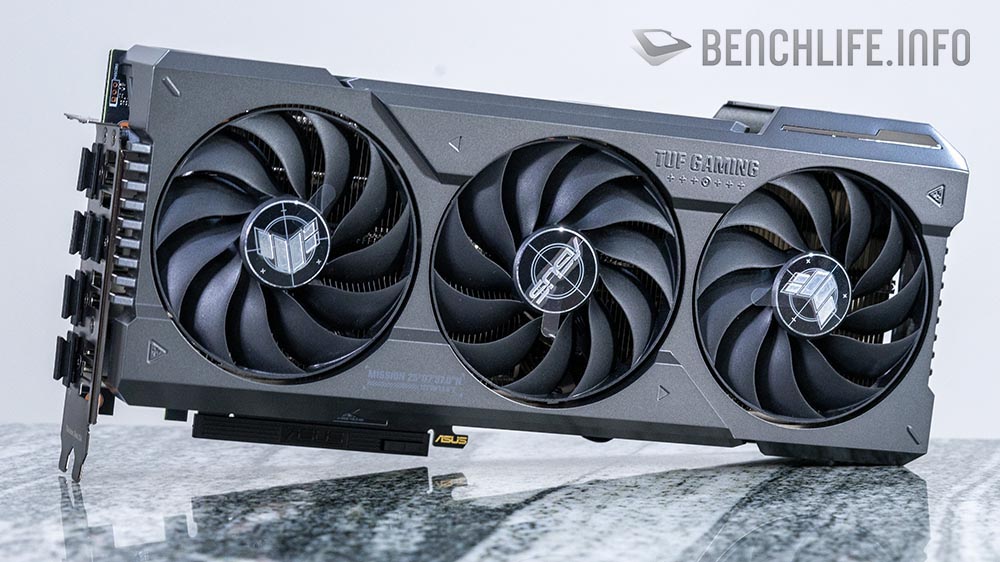
ASUS 這張顯示卡在設計上採用 3 風扇設計,但相較於我們測試的 AORUS GeForce RTX 4070 Ti ELITE 來說,TUF Gaming GeForce RTX 4070 Ti 顯示卡要「輕巧」許多。
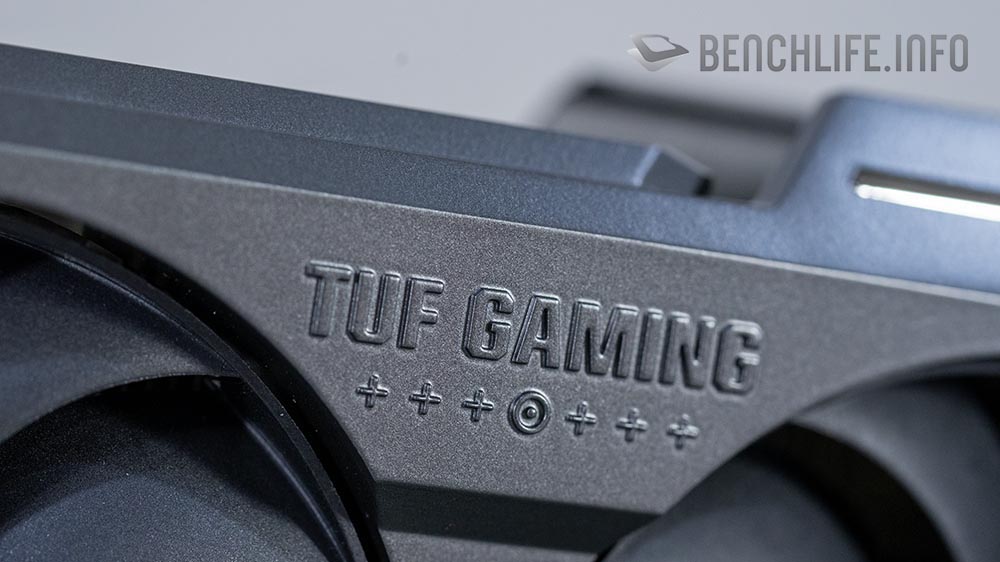
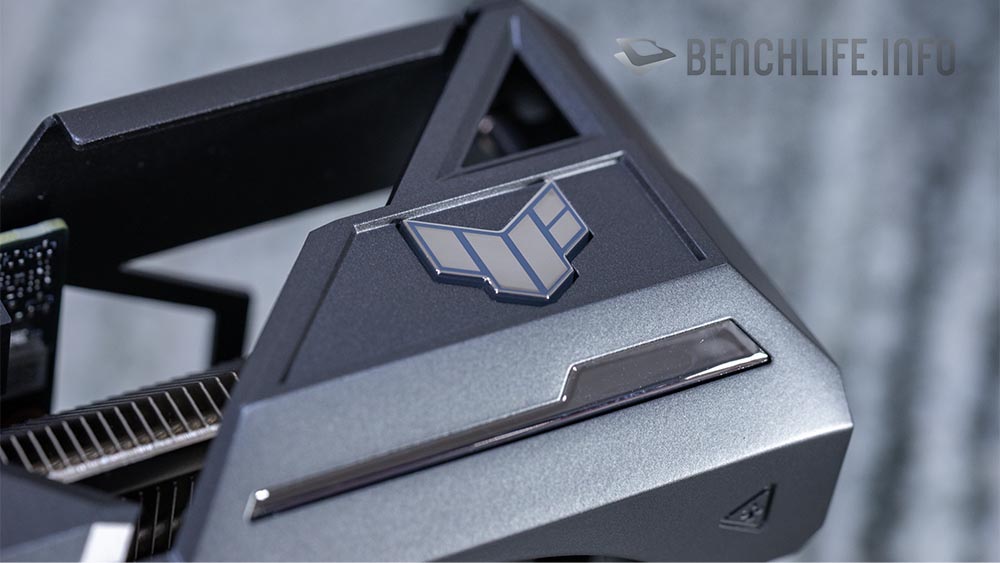
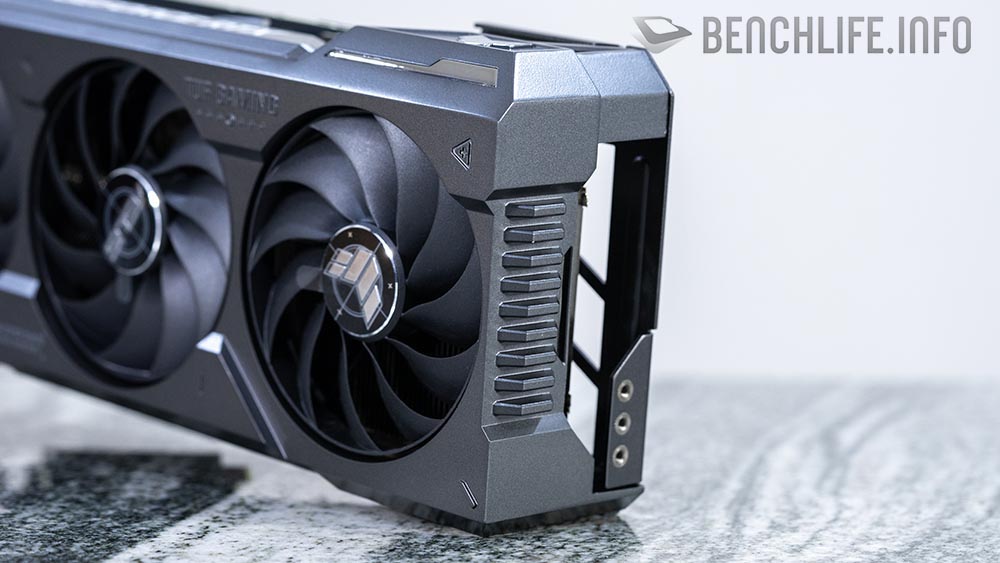
設計上,TUF Gaming GeForce RTX 4070 Ti 為 3.25 slot 設計,而 GeForce RTX 4080 為 3.65 slot 設計;散熱器厚度縮減的主要原因當然與顯示卡 TGP 有關聯,GeForce RTX 4080 TGP 為 320W,至於這次的主角 GeForce RTX 4070 Ti 則是 285W。
尺寸縮小後,散熱器成本當然也會因為這樣而節省一些。
TUF Gaming GeForce RTX 4070 Ti 散熱器沒有加入 Vapor Chamber,用銅底與 5 根熱導管結合協助 GPU 散熱。
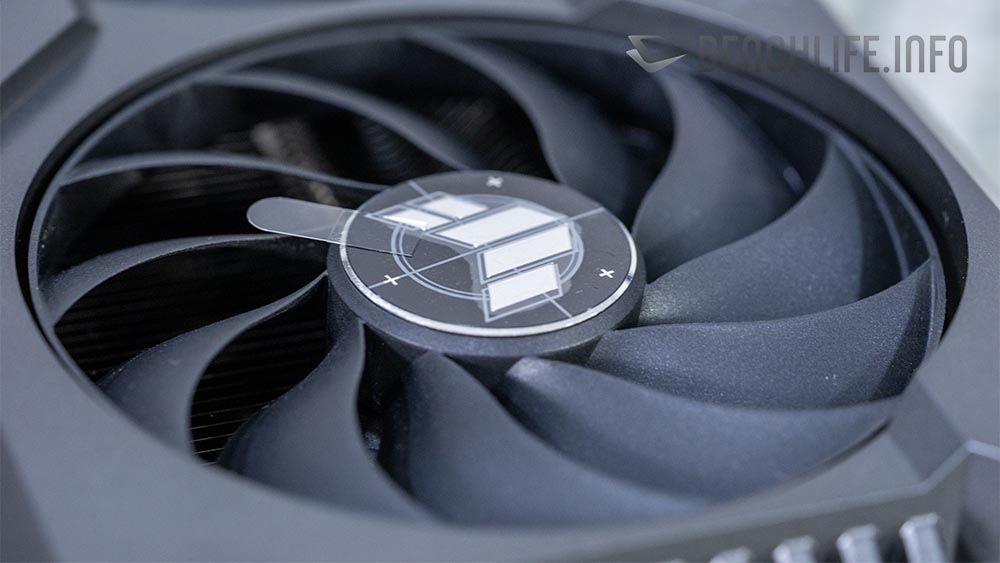
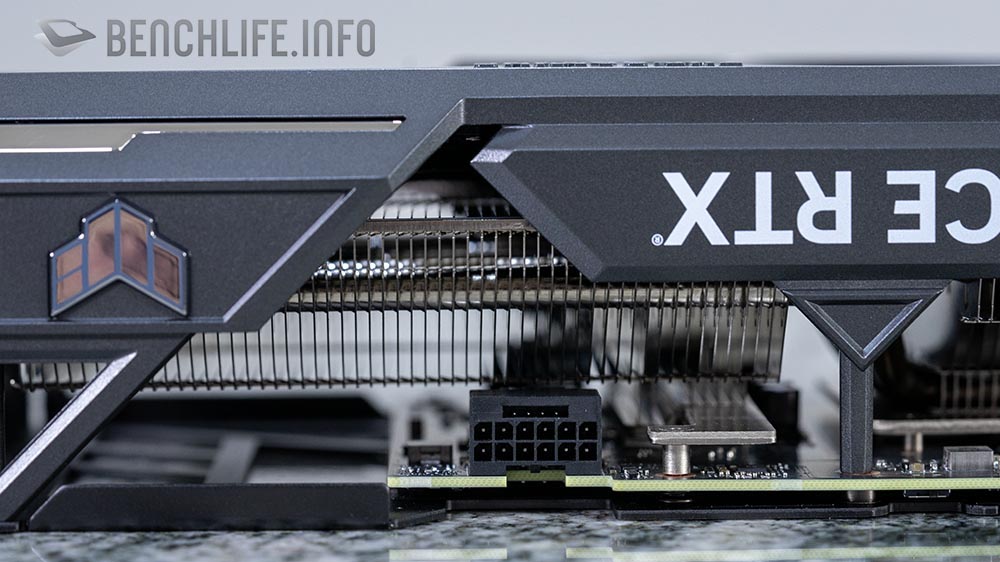
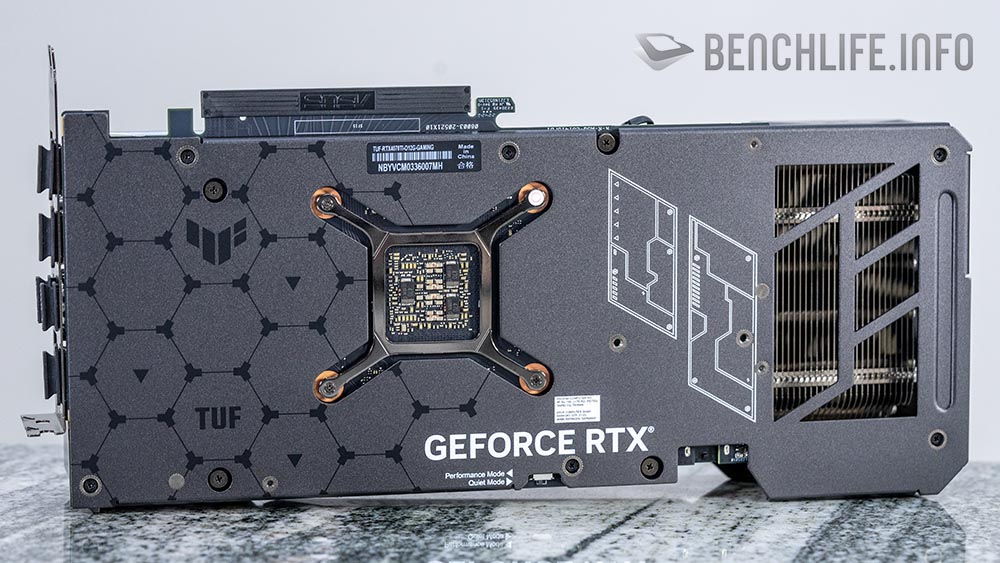
風扇部分使用的是招牌的 Axial-tech 的 Double Ball Bearing 風扇,透過更強大的風壓與風流,將散熱器熱快速帶走。風扇部分採用逆、正、逆的方式旋轉,搭配上 0dB(A) 的停轉模式,讓顯示卡風扇在 50 度以下停止轉動,至於風扇開始旋轉的溫度為 55 度。
雖然我們沒有拆解顯示卡,但透過 ASUS 給出的技術文件知道 TUF Gaming GeForce RTX 4070 TI 顯示卡採用 8 + 3 供電設計(GPU + MEMORY);GPU 部分的控制器型號為 UP9512R,MEM 方面則是 UP9529Q。
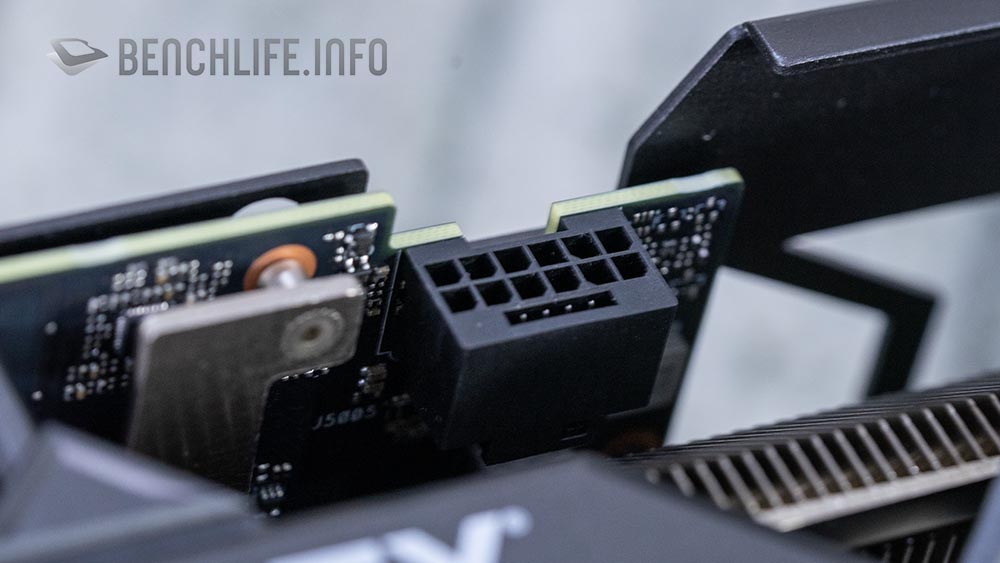
由於 TGP 只有 285W,因此 TUF Gaming GeForce RTX 4070 Ti 搭配的是 2x 8 Pin to 12VHPWR 轉接線。
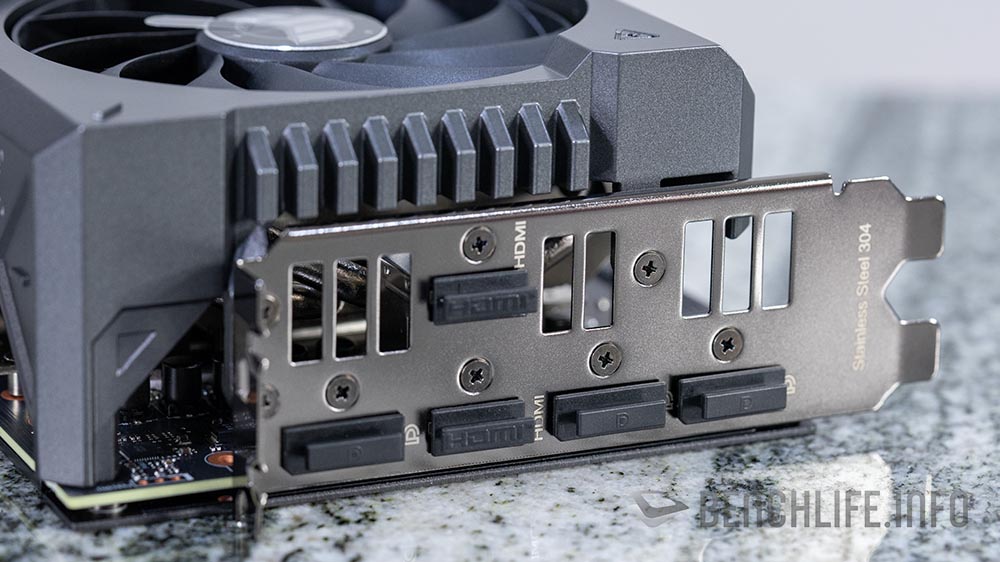
訊號輸出端子部分與 GeForce RTX 4080 或是 GeForce RTX 4090 沒有太大不同,一樣是 DisplayPort 1.4 與 HDMI 2.1 等配置。
測試部分我們使用 AMD Ryzen 9 7900X 進行,搭配的主機板為 Crosshair X670E Hero,而記憶體部分則是 DDR5-6000 MT/s。
3DMark:
| 3DMark | GeForce RTX 4080 | GeForce RTX 4070 Ti | |
|---|---|---|---|
| TIme Spy | 25291 | 21283 | -18.832% |
| Graphic score | 27958 | 23061 | -21.235% |
| CPU score | 16418 | 14814 | -10.828% |
| Time Spy Extreme | 13167 | 10933 | -20.434% |
| Graphic score | 13921 | 11105 | -25.358% |
| CPU score | 10078 | 10056 | -0.219% |
| Fire Strike | 45371 | 43552 | -4.177% |
| Graphic score | 61983 | 55288 | -12.109% |
| Physics score | 41245 | 41203 | -0.102% |
| Combo score | 15864 | 17377 | 8.707% |
| Fire Strike Extreme | 30856 | 26565 | -16.153% |
| Graphic score | 32663 | 27603 | -18.331% |
| Physics score | 42559 | 41157 | -3.406% |
| Combo score | 16888 | 14647 | -15.300% |
| Fire Strike Ultra | 17199 | 14024 | -22.640% |
| Graphic score | 16945 | 13754 | -23.201% |
| Physics score | 42594 | 41201 | -3.381% |
| Combo score | 9653 | 7613 | -26.796% |
| Port Royal | 17819 | 14357 | -24.114% |
| Ray Tracing | 84.36 | 69.2 | -21.908% |
| Speed Way | 7099 | 5486 | -29.402% |
| PCIE bandwidth | 26.82 | 26.85 | 0.112% |
| DLSS Feature test | |||
| native | 38.62 | 30.19 | -27.923% |
| DLSS 3 | 132.71 | 106.43 | -24.692% |
4K Gaming 包含 Ray Tracing:
| 4K Gaming | GeForce RTX 4080 | GeForce RTX 4070 Ti | |
|---|---|---|---|
| Assassin Creed Vahalla | 95 | 81 | -17.284% |
| Borderlands 3 : bad ass | 90.22 | 70.07 | -28.757% |
| Cyberpunk2077 | 64.8 | 50.46 | -28.419% |
| Cyberpunk2077(RT) | 30.81 | 21.51 | -43.236% |
| Cyberpunk2077(RT + DLSS 3 / FSR) | 83.31 | 66.9 | -24.529% |
| Tom Clancy’s The Division 2 | 115 | 92 | -25.000% |
| Metro Exodus | 104.33 | 83.51 | -24.931% |
| Metro Exodus(RT + High) | 74.93 | 60.18 | -24.510% |
| Metro Exodus(RT + High + DLSS) | 110.56 | 89.48 | -23.558% |
| F1 22(RT + Ultra High) | 61 | 48 | -27.083% |
| F1 22(RT + DLSS) | 100 | 85 | -17.647% |
| F1 22(RT + DLSS 3) | 130 | 106 | -22.642% |
| Far Cry 6 | 110 | 90 | -22.222% |
| Far Cry 6(RT) | 96 | 80 | -20.000% |
| Guardian of Galaxy | 140 | 113 | -23.894% |
| Guardian of Galaxy(RT + Ultra) | 72 | 58 | -24.138% |
| Forza Horzion 5(RT + Extreme) | 112 | 94 | -19.149% |
| Horizon Zero Dawn | 117 | 92 | -27.174% |
| Portal RTX (DLSS) | 51.1 | 40 | -27.750% |
| Portal RTX (DLSS 3) | 79.31 | 63.4 | -25.095% |
| Rainbow Six Siege | 410 | 347 | -18.156% |
| Shadow of the Tomb Raider | 134 | 104 | -28.846% |
| Shadow of the Tomb Raider(RT + Ultra) | 88 | 70 | -25.714% |
| SpiderMan Miles Moral | 103.4 | 83 | -24.578% |
| SpiderMan Miles Moral(RT + Very High) | 49.7 | 40.9 | -21.516% |
| SpiderMan Miles Moral(RT + Very High + DLSS / FSR) | 109.8 | 90.5 | -21.326% |
| Total War: Troy | 118.7 | 93.6 | -26.816% |
| WarHammer Darktide | 65.7 | 50.9 | -29.077% |
| WarHammer Darktide(RT + High) | 39.9 | 30.1 | -32.558% |
| WarHammer Darktide(RT + High + DLSS) | 86.4 | 68.9 | -25.399% |
| WarHammer Darktide(RT + High + DLSS 3) | 121.4 | 99 | -22.626% |
| Watch Dog Legion | 87 | 68 | -27.941% |
| Watch Dog Legion(RT + Ultra) | 46 | 36 | -27.778% |
| Watch Dog Legion(RT + Ultra + DLSS) | 76 | 62 | -22.581% |
1440p Gaming 包含 Ray Tracing:
| 1440p Gaming | GeForce RTX 4080 | GeForce RTX 4070 Ti | |
|---|---|---|---|
| Assassin Creed Vahalla | 153 | 133 | -15.038% |
| Borderlands 3 : bad ass | 168.9 | 133.34 | -26.669% |
| Cyberpunk2077 | 132.69 | 106.73 | -24.323% |
| Cyberpunk2077(RT) | 63.15 | 50.29 | -25.572% |
| Cyberpunk2077(RT + DLSS 3 / FSR) | 132.46 | 117 | -13.214% |
| Tom Clancy’s The Division 2 | 215 | 176 | -22.159% |
| Metro Exodus | 153.8 | 127.96 | -20.194% |
| Metro Exodus(RT + High) | 125.28 | 103.64 | -20.880% |
| Metro Exodus(RT + High + DLSS) | 153.33 | 132.4 | -15.808% |
| F1 22(RT + Ultra High) | 112 | 97 | -15.464% |
| F1 22(RT + DLSS) | 157 | 144 | -9.028% |
| F1 22(RT + DLSS 3) | 226 | 201 | -12.438% |
| Far Cry 6 | 154 | 147 | -4.762% |
| Far Cry 6(RT) | 121 | 117 | -3.419% |
| Guardian of Galaxy | 182 | 187 | 2.674% |
| Guardian of Galaxy(RT + Ultra) | 133 | 109 | -22.018% |
| Forza Horzion 5(RT + Extreme) | 146 | 133 | -9.774% |
| Horizon Zero Dawn | 201 | 172 | -16.860% |
| Portal RTX (DLSS) | 107.9 | 59.9 | -80.134% |
| Portal RTX (DLSS 3) | 158.5 | 132.2 | -19.894% |
| Rainbow Six Siege | 704 | 627 | -12.281% |
| Shadow of the Tomb Raider | 240 | 201 | -19.403% |
| Shadow of the Tomb Raider(RT + Ultra) | 165 | 135 | -22.222% |
| SpiderMan Miles Moral | 158 | 141.7 | -11.503% |
| SpiderMan Miles Moral(RT + Very High) | 90.8 | 76.4 | -18.848% |
| SpiderMan Miles Moral(RT + Very High + DLSS / FSR) | 199.9 | 126.5 | -58.024% |
| Total War: Troy | 199.9 | 182.8 | -9.354% |
| WarHammer Darktide | 203.1 | 168.4 | -20.606% |
| WarHammer Darktide(RT + High) | 125.2 | 99.1 | -26.337% |
| WarHammer Darktide(RT + High + DLSS) | 73.3 | 85.4 | 14.169% |
| WarHammer Darktide(RT + High + DLSS 3) | 131.8 | 113.3 | -16.328% |
| Watch Dog Legion | 132 | 119 | -10.924% |
| Watch Dog Legion(RT + Ultra) | 85 | 70 | -21.429% |
| Watch Dog Legion(RT + Ultra + DLSS) | 99 | 97 | -2.062% |
1080p Gaming 包含 Ray Tracing:
| 1080p Gaming | GeForce RTX 4080 | GeForce RTX 4070 Ti | |
|---|---|---|---|
| Assassin Creed Vahalla | 189 | 168 | -12.500% |
| Borderlands 3 : bad ass | 224.29 | 189.67 | -18.253% |
| Cyberpunk2077 | 190.73 | 164.17 | -16.178% |
| Cyberpunk2077(RT) | 99.14 | 80.58 | -23.033% |
| Cyberpunk2077(RT + DLSS 3 / FSR) | 133.54 | 121.24 | -10.145% |
| Tom Clancy’s The Division 2 | 277 | 251 | -10.359% |
| Metro Exodus | 179.24 | 153.73 | -16.594% |
| Metro Exodus(RT + High) | 152.04 | 132.93 | -14.376% |
| Metro Exodus(RT + High + DLSS) | 157.21 | 148.52 | -5.851% |
| F1 22(RT + Ultra High) | 136 | 152 | 10.526% |
| F1 22(RT + DLSS) | 175 | 167 | -4.790% |
| F1 22(RT + DLSS 3) | 282 | 212 | -33.019% |
| Far Cry 6 | 149 | 154 | 3.247% |
| Far Cry 6(RT) | 121 | 120 | -0.833% |
| Guardian of Galaxy | 182 | 186 | 2.151% |
| Guardian of Galaxy(RT + Ultra) | 161 | 157 | -2.548% |
| Forza Horzion 5(RT + Extreme) | 158 | 146 | -8.219% |
| Horizon Zero Dawn | 229 | 208 | -10.096% |
| Portal RTX (DLSS) | 143.7 | 140.62 | -2.190% |
| Portal RTX (DLSS 3) | 235.8 | 200.9 | -17.372% |
| Rainbow Six Siege | 728 | 712 | -2.247% |
| Shadow of the Tomb Raider | 281 | 244 | -15.164% |
| Shadow of the Tomb Raider(RT + Ultra) | 218 | 192 | -13.542% |
| SpiderMan Miles Moral | 165 | 169.6 | 2.712% |
| SpiderMan Miles Moral(RT + Very High) | 117.4 | 102.4 | -14.648% |
| Total War: Troy | 245.8 | 211.9 | -15.998% |
| WarHammer Darktide | 198.3 | 152.7 | -29.862% |
| WarHammer Darktide(RT + High) | 103.3 | 85.4 | -20.960% |
| WarHammer Darktide(RT + High + DLSS) | 148.4 | 131.3 | -13.024% |
| WarHammer Darktide(RT + High + DLSS 3) | 256.4 | 165.8 | -54.644% |
| Watch Dog Legion | 144 | 141 | -2.128% |
| Watch Dog Legion(RT + Ultra) | 100 | 94 | -6.383% |
| Watch Dog Legion(RT + Ultra + DLSS) | 97 | 98 | 1.020% |
從 3DMark、4K 到 1440p 解析度的遊戲測試可以見到 GeForce RTX 4070 Ti 效能與 GeForce RTX 4080 接近 3 成的差距,但到了 1080p 部份則是拉近到 2 成上下,這主要是因為 CPU Bound(CPU 受限)所致。
另一方面,我們也找了 2019 年發表的 GeForce RTX 2070 Super 與 GeForce RTX 4070 Ti 進行比較;採用 12nm 製程的 GeForce RTX 2070 Super 屬於 Turing 架構,是 NVIDIA 在 2019 年 7 月發售的產品。
Turing 架構是首款導入 RT Cores 與 Ray Tracing 技術的 NVIDIA GeForce RTX 顯示卡。
3DMark – GeForce RTX 2070 Super:
| 3DMark | GeForce RTX 2070 Super | GeForce RTX 4070 Ti | |
|---|---|---|---|
| TIme Spy | 10439 | 21283 | 50.951% |
| Graphic score | 9023 | 23061 | 60.873% |
| CPU score | 14802 | 14814 | 0.081% |
| Time Spy Extreme | 5045 | 10933 | 53.855% |
| Graphic score | 4642 | 11105 | 58.199% |
| CPU score | 9944 | 10056 | 1.114% |
| Fire Strike | 24551 | 43552 | 43.628% |
| Graphic score | 25089 | 55288 | 54.621% |
| Physics score | 40852 | 41203 | 0.852% |
| Combo score | 13961 | 17377 | 19.658% |
| Fire Strike Extreme | 11998 | 26565 | 54.835% |
| Graphic score | 12029 | 27603 | 56.421% |
| Physics score | 40993 | 41157 | 0.398% |
| Combo score | 5768 | 14647 | 60.620% |
| Fire Strike Ultra | 6157 | 14024 | 56.097% |
| Graphic score | 5919 | 13754 | 56.965% |
| Physics score | 40968 | 41201 | 0.566% |
| Combo score | 3123 | 7613 | 58.978% |
| Port Royal | 5882 | 14357 | 59.030% |
| Ray Tracing | - | 69.2 | 100.000% |
| Speed Way | 2031 | 5486 | 62.978% |
| PCIE bandwidth | - | 26.85 | 100.000% |
| DLSS Feature test | |||
| native | - | 30.19 | 100.000% |
| DLSS 3 | - | 106.43 | 100.000% |
1440p Gaming – GeForce RTX 2070 Super:
| 1440p Gaming | GeForce RTX 2070 Super | GeForce RTX 4070 Ti | |
|---|---|---|---|
| Assassin Creed Vahalla | 66 | 133 | 50.376% |
| Borderlands 3 : bad ass | 56.01 | 133.34 | 57.995% |
| Cyberpunk2077 | 51.21 | 106.73 | 52.019% |
| Cyberpunk2077(RT) | 19.29 | 50.29 | 61.642% |
| Cyberpunk2077(RT + DLSS / FSR) | 48.35 | 117 | 58.675% |
| Tom Clancy’s The Division 2 | 77 | 176 | 56.250% |
| F1 22(RT + Ultra High) | 38 | 97 | 60.825% |
| F1 22(RT + DLSS) | 62 | 144 | 56.944% |
| Far Cry 6 | 76 | 147 | 48.299% |
| Far Cry 6(RT) | 63 | 117 | 46.154% |
| Guardian of Galaxy | 100 | 187 | 46.524% |
| Guardian of Galaxy(RT + Ultra) | 43 | 109 | 60.550% |
| Forza Horzion 5(RT + Extreme) | 59 | 133 | 55.639% |
| Rainbow Six Siege | 308.1 | 627 | 50.861% |
| Shadow of the Tomb Raider | 87 | 201 | 56.716% |
| Shadow of the Tomb Raider(RT + Ultra) | 53 | 135 | 60.741% |
| Total War: Troy | 70.7 | 182.8 | 61.324% |
| Watch Dog Legion | 49 | 119 | 58.824% |
| Watch Dog Legion(RT + Ultra) | 19 | 70 | 72.857% |
| Watch Dog Legion(RT + Ultra + DLSS) | 16 | 97 | 83.505% |
從數據來看,也須使用 Turing 架構的玩家們可以考慮更換顯示卡了。
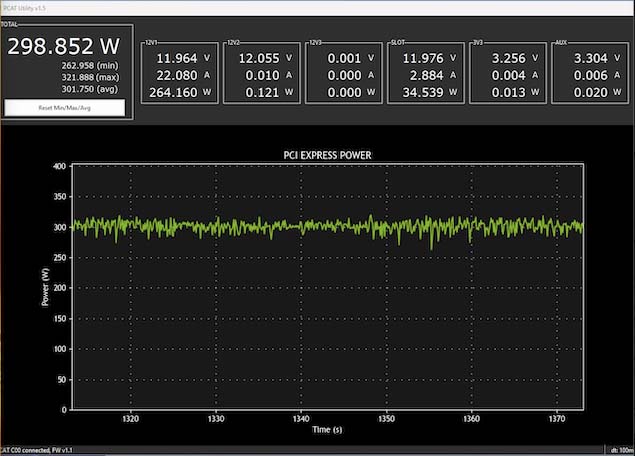
透過 NVIDIA 提供的 PCAT 裝置,我們可以抓到 TUF Gaming GeForce RTX 4070 Ti 在 Furmark 滿載條件下的平均功耗在 301W;若是以遊戲進行測試的話,GeForce RTX 4070 Ti 的平均功耗會低於 Furmark 時所抓取的功耗。
如果不與 AMD Radeon RX 7900 XT 做比較的話,單純就 NVIDIA GeForce RTX 40 系列的產品規劃來看,799 美元的 GeForce RTX 4070 Ti 表現要比 GeForce RTX 4080 更有吸引力。較為可惜的是 899 美元的 AMD Radeon RX 7900 XT 就卡在那邊,讓人不免會拿來做比較。
就如我們在 GIGABYTE AORUS GeForce RTX 4070 Ti ELITE 測試中提到的,如果要體驗 Ray Tracing 以及 DLSS 3 的玩家,相較 GeForce RTX 4090 或者是 GeForce RTX 4080,NVIDIA GeForce RTX 4070 Ti 從定價、規格與效能來看,可能更適合入手。
對於 ASUS 的 TUF Gaming GeForce RTX 4070 Ti 這款 3.25 slot 的顯示卡,我們認為相當適合一般玩家裝入機箱內,另外在安裝時也要注意 12VHPWR 轉接線是否有插緊。