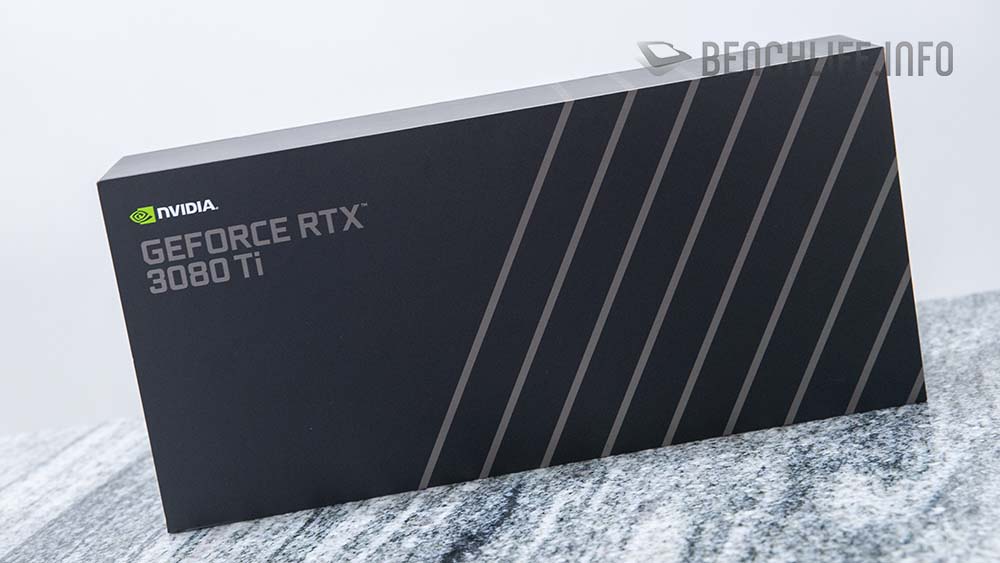
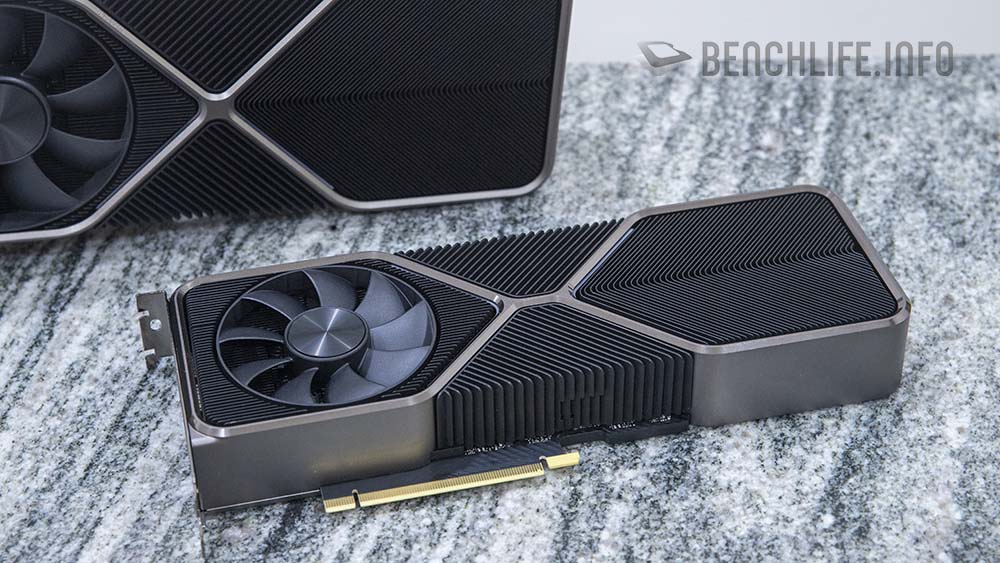
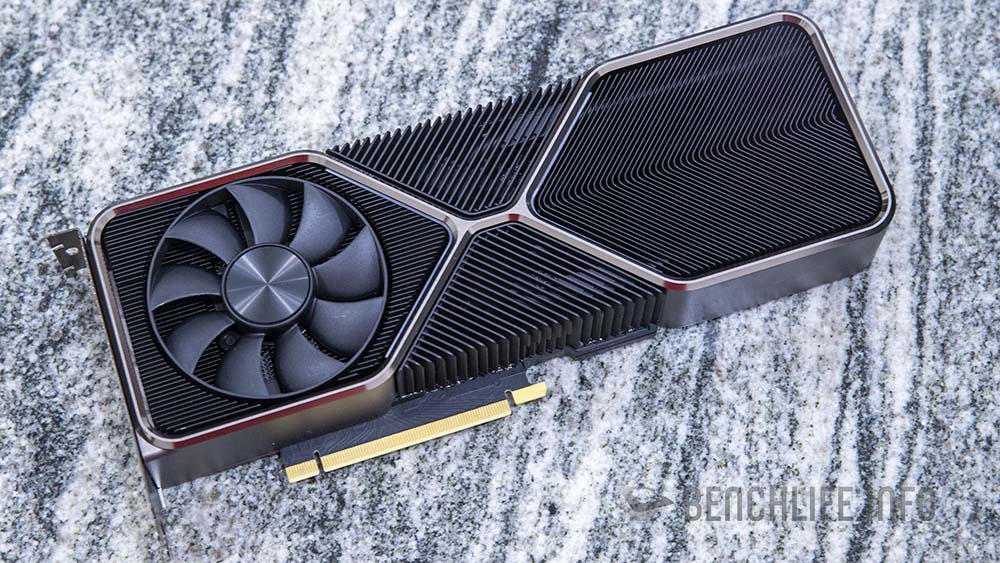
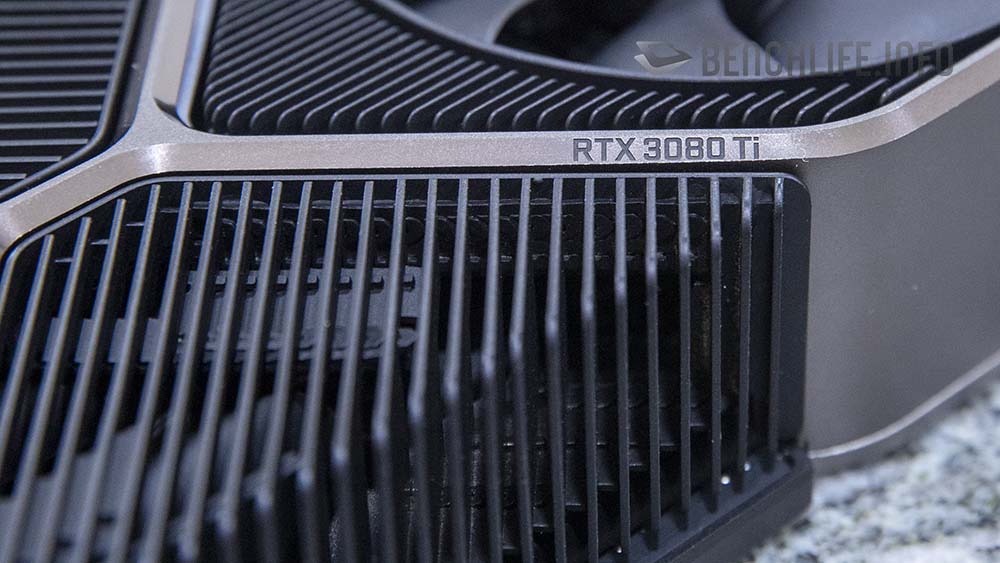
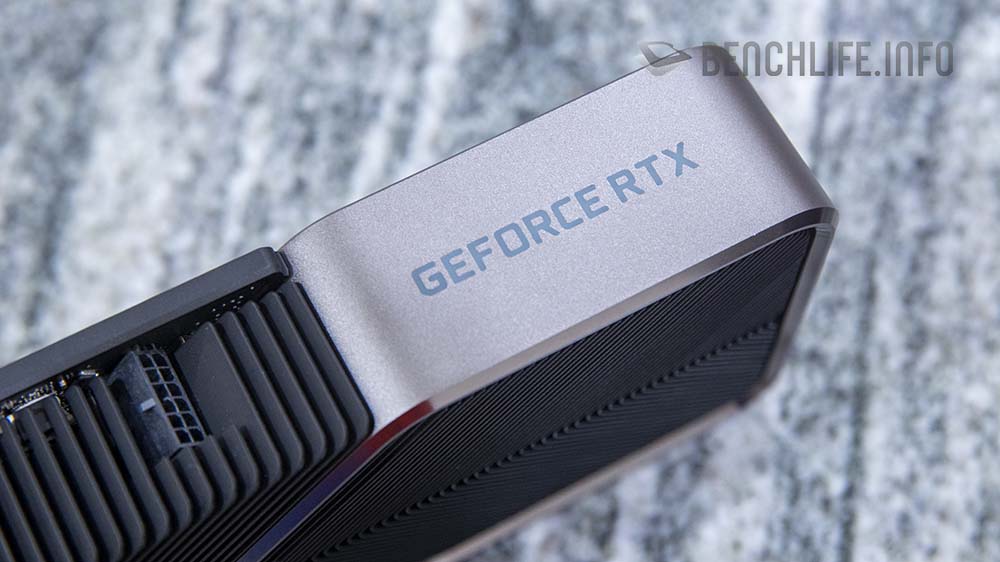
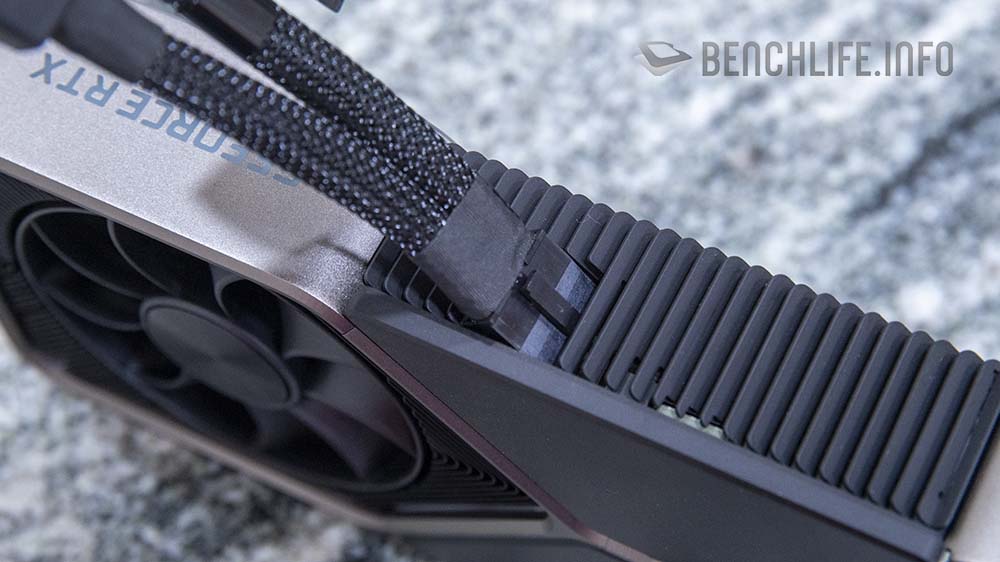
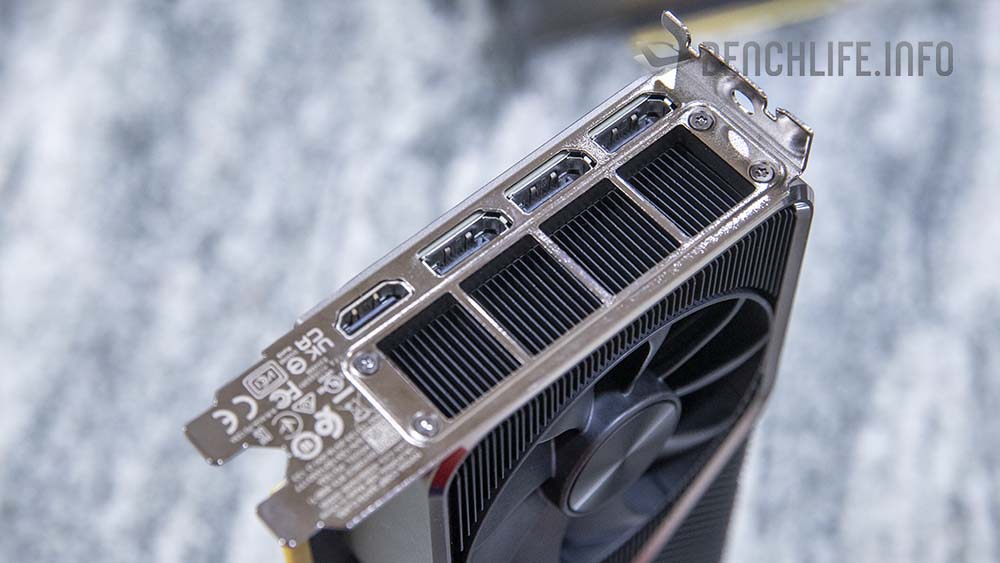
距離 GeForce RTX 3080 發表近 10 個月的時間,NVIDIA 在 Computex 2021 Keynote 上正式發表了 GeForce RTX 3080 Ti 與 GeForce RTX 3070 Ti。
對於 GeForce RTX 3080 Ti 與 GeForce RTX 3070 Ti 的消息其實我們一直都有聽到,特別是 GeForce RTX 3080 Ti 部分,推出的時間與規格更是有多種不同傳聞,但我們都清楚,產品只有在正式發表後,才會真實存在。
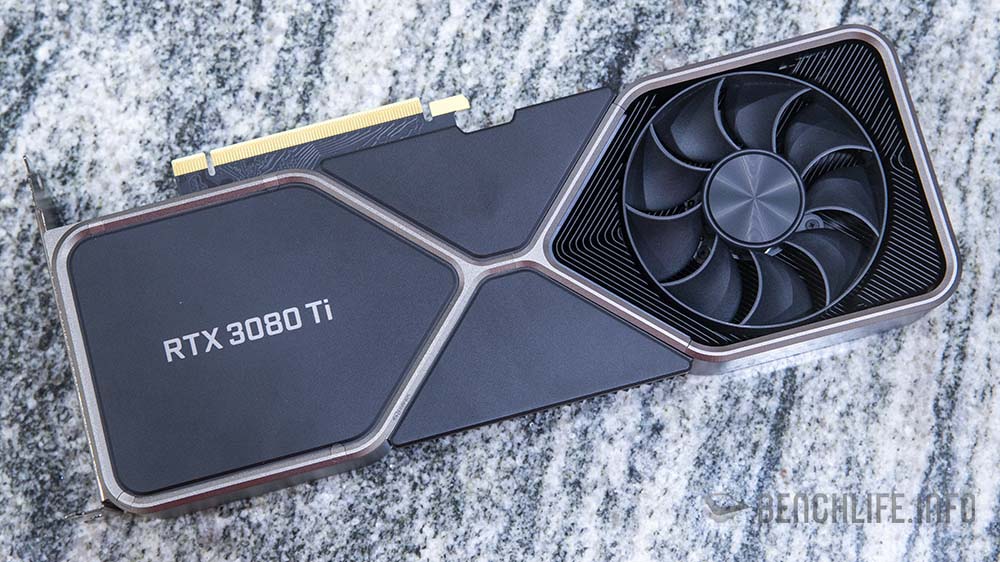
GeForce RTX 3080 Ti
從一開始傳聞的 20GB GDDR6X 記憶體配置,到最終的 12GB GDDR6X 記憶體配置,雖然記憶體大小降低不少,但也較 GeForce RTX 3080 有誠意許多(當然不是指價格部分…)。的各項規格來看,GeForce RTX 3080 Ti 的各項數值都要較 GeForce RTX 3080 要高許多,因此稱之為「Ti」屬相當合理的規劃。
| GeForce RTX 3080 Ti 12GB | GeForce RTX 3080 10GB | |
|---|---|---|
| GPU Codename | GA102 | GA102 |
| GPU Architecture | Ampere | Ampere |
| SMs | 80 | 68 |
| CUDA Cores / GPU | 10240 | 8704 |
| Tensor Cores / GPU | 320(3rd Gen) | 272(3rd Gen) |
| RT Cores | 80(2nd Gen) | 68(2nd Gen) |
| GPU Boost Clock | 1665MHz | 1710MHz |
| Memory | 12GB GDDR6X | 10GB GDDR6X |
| Memory Interface | 384-bit | 320-bit |
| Memory Bandwidth | 912GB/s | 760GB/s |
| ROPs | 112 | 96 |
| TGP | 350W | 320W |
規格表可以見到 CUDA Cores 明顯增加外,GeForce RTX 3080 Ti 在 RT Cores 以及 Tensor Cores 都有著強化,所以使用者在 Ray Tracing 遊戲體驗上較 GeForce RTX 3080 會有更佳的體驗。
新推出的 GeForce RTX 3080 Ti 在 NVIDIA 給出的 Reviewer Guide 是與 Turing 架構的 GeForce RTX 2080 Ti 進行比較,但對於部分使用 GeForce RTX 2080 Ti 的玩家,可能早已經轉換到到 Ampere 架構的 GeForce RTX 3080 或者是旗艦的 GeForce RTX 3090 使用。
雖然提到 GeForce RTX 2080 Ti,但這裡並不打算使用這款顯示卡進行測試,反倒是選擇旗艦的 GeForce RTX 3090 以及 AMD Radeon RX 6900 XT,再搭配上 GeForce RTX 3080 來與 GeForce RTX 3080 Ti 進行比較。
首先是 GeForce RTX 3080 Ti 與 GeForce RTX 3080,當然我們已經可以預見 GeForce RTX 3080 Ti 會有著不錯的表現。
| GeForce RTX 3080 | GeForce RTX 3080 Ti | ||
|---|---|---|---|
| 3DMark | |||
| TIme Spy | 16779 | 17681 | 5.102 |
| Time Spy Extreme | 8626 | 9375 | 7.989 |
| Port Royal | 11465 | 12515 | 8.39 |
| Fire Strike | 34469 | 36225 | 4.847 |
| Fire Strike Extreme | 20683 | 22582 | 8.409 |
| Fire Strike Ultra | 11169 | 12320 | 9.342 |
| Ray Tracing | 48.01 | 54.33 | 11.633 |
| 4K Gaming | |||
| Assassin Creed Vahalla | 57 | 62 | 8.065 |
| Borderlands 3 : bad ass (DX11) | 62.97 | 69.32 | 9.160 |
| Borderlands 3 : bad ass (DX12) | 61.77 | 66.44 | 7.029 |
| Control | 60.59 | 63.94 | 5.239 |
| Control RT_High | 36.48 | 39.9 | 8.571 |
| Control RT+DLSS | 66.21 | 72.33 | 8.461 |
| Cyberpunk (Ultra) | 40.57 | 44.29 | 8.399 |
| Cyberpunk (RTUltra+DLSS_off) | 16.84 | 21.69 | 22.360 |
| Dirt 5 | 89.8 | 97.7 | 8.086 |
| Dirt 5(RT) | 76.7 | 77.3 | 0.776 |
| Metro Exouds {Ultra) | 66.63 | 73.38 | 9.197 |
| Metro Exodus Enhancded Edition Ultra preset (RT high) | 47.52 | 54.32 | 12.518 |
| Far Cry 5 (ultra preset) | 99 | 108 | 8.333 |
| Gears 5 | 68.8 | 74.1 | 7.152 |
| Godfall (Epic) | 66.3 | 73.3 | 9.550 |
| Godfall (RT) | 55.3 | 65.3 | 15.314 |
| Horizon Zero Dawn | 83 | 90 | 7.778 |
| Shadow of the Tomb Raider (highest) | 86 | 94 | 8.511 |
| Shadow of the Tomb Raider(RT_ULTRA) | 52 | 57 | 8.772 |
| Total War: Troy Ultra : battle | 52.3 | 59 | 11.356 |
| Watch Dog Legion | 54 | 60 | 10 |
| Watch Dog Legion(RT_Ultra) | 29 | 33 | 12.121 |
| 1440p | |||
| Assassin Creed Vahalla | 83 | 87 | 4.598 |
| Borderlands 3 : bad ass (DX11) | 110.49 | 120.85 | 8.573 |
| Borderlands 3 : bad ass (DX12) | 108.01 | 115.76 | 6.695 |
| Control | 112.09 | 121.46 | 7.714 |
| Control RT_High | 71.33 | 78.5 | 9.134 |
| Control RT+DLSS | 116.01 | 125.12 | 7.281 |
| Cyberpunk (Ultra) | 75.85 | 82.13 | 7.646 |
| Cyberpunk (RTUltra+DLSS_off) | 39.93 | 43.73 | 8.690 |
| Dirt 5 | 125.3 | 135.5 | 7.528 |
| Dirt 5(RT) | 113.2 | 119.5 | 5.272 |
| Metro Exodus (Ultra) | 99.97 | 110.85 | 9.815 |
| Metro Exodus Enhancded Edition Ultra preset (RT high) | 81.06 | 89.24 | 9.167 |
| Far Cry 5 (ultra preset) | 156 | 161 | 3.106 |
| Gears 5 | 115.1 | 122.1 | 5.733 |
| Godfall (Epic) | 112.1 | 123 | 8.862 |
| Godfall (RT) | 98 | 112.2 | 12.656 |
| Horizon Zero Dawn | 136 | 147 | 7.483 |
| Shadow of the Tomb Raider (highest) | 151 | 161 | 6.211 |
| Shadow of the Tomb Raider(RT_ULTRA) | 94 | 101 | 6.931 |
| Total War: Troy Ultra : battle | 95.8 | 110.3 | 13.146 |
| Watch Dog Legion | 83 | 92 | 9.783 |
| Watch Dog Legion(RT_Ultra) | 52 | 57 | 8.772 |
跟著看到 GeForce RTX 3080 Ti 與 GeForce RTX 3090,當然 GeForce RTX 3090 在表現上還是較 GeForce RTX 3080 Ti 強勢。
| GeForce RTX 3090 | GeForce RTX 3080 Ti | ||
|---|---|---|---|
| 3DMark | |||
| TIme Spy | 17672 | 17681 | 0.051 |
| Time Spy Extreme | 9698 | 9375 | -3.445 |
| Port Royal | 13400 | 12515 | -7.072 |
| Fire Strike | 36108 | 36225 | 0.323 |
| Fire Strike Extreme | 23358 | 22582 | -3.436 |
| Fire Strike Ultra | 12931 | 12320 | -4.959 |
| Ray Tracing | 58.02 | 54.33 | -6.792 |
| 4K Gaming | |||
| Assassin Creed Vahalla | 60 | 62 | 3.226 |
| Borderlands 3 : bad ass (DX11) | 73.79 | 69.32 | -6.448 |
| Borderlands 3 : bad ass (DX12) | 71.93 | 66.44 | -8.263 |
| Control | 68.96 | 63.94 | -7.851 |
| Control RT_High | 42.62 | 39.9 | -6.817 |
| Control RT+DLSS | 76.46 | 72.33 | -5.71 |
| Cyberpunk (Ultra) | 47.3 | 44.29 | -6.796 |
| Cyberpunk (RTUltra+DLSS_off) | 23.14 | 21.69 | -6.685 |
| Dirt 5 | 101.3 | 97.7 | -3.685 |
| Dirt 5(RT) | 84.3 | 77.3 | -9.056 |
| Metro Exouds {Ultra) | 76.14 | 73.38 | -3.761 |
| Metro Exodus Enhancded Edition Ultra preset (RT high) | 56.7 | 54.32 | -4.381 |
| Far Cry 5 (ultra preset) | 110 | 108 | -1.852 |
| Gears 5 | 78.9 | 74.1 | -6.478 |
| Godfall (Epic) | 77.1 | 73.3 | -5.184 |
| Godfall (RT) | 69.6 | 65.3 | -6.585 |
| Horizon Zero Dawn | 95 | 90 | -5.556 |
| Shadow of the Tomb Raider (highest) | 99 | 94 | -5.319 |
| Shadow of the Tomb Raider(RT_ULTRA) | 61 | 57 | -7.018 |
| Total War: Troy Ultra : battle | 60.5 | 59 | -2.542 |
| Watch Dog Legion | 61 | 60 | -1.667 |
| Watch Dog Legion(RT_Ultra) | 34 | 33 | -3.030 |
| 1440P Gaming | |||
| Assassin Creed Vahalla | 85 | 87 | 2.299 |
| Borderlands 3 : bad ass (DX11) | 123.5 | 120.85 | -2.193 |
| Borderlands 3 : bad ass (DX12) | 122.79 | 115.76 | -6.073 |
| Control | 128.69 | 121.46 | -5.953 |
| Control RT_High | 82.28 | 78.5 | -4.815 |
| Control RT+DLSS | 113.94 | 125.12 | 8.935 |
| Cyberpunk (Ultra) | 85.14 | 82.13 | -3.665 |
| Cyberpunk (RTUltra+DLSS_off) | 45.67 | 43.73 | -4.436 |
| Dirt 5 | 150.1 | 135.5 | -10.775 |
| Dirt 5(RT) | 124.4 | 119.5 | -4.100 |
| Metro Exodus (Ultra) | 112.96 | 110.85 | -1.903 |
| Metro Exodus Enhancded Edition Ultra preset (RT high) | 92.12 | 89.24 | -3.227 |
| Far Cry 5 (ultra preset) | 141 | 161 | 12.422 |
| Gears 5 | 135.7 | 122.1 | -11.138 |
| Godfall (Epic) | 129.6 | 123 | -5.366 |
| Godfall (RT) | 121.6 | 112.2 | -8.378 |
| Horizon Zero Dawn | 147 | 147 | 0 |
| Shadow of the Tomb Raider (highest) | 157 | 161 | 2.485 |
| Shadow of the Tomb Raider(RT_ULTRA) | 106 | 101 | -4.950 |
| Total War: Troy Ultra : battle | 108.9 | 110.3 | 1.269 |
| Watch Dog Legion | 84 | 92 | 8.696 |
| Watch Dog Legion(RT_Ultra) | 56 | 57 | 1.754 |
最後當然是看到 GeForce RTX 3080 Ti 與 AMD Radeon RX 6900 XT 的比較。
| RX 6900 XT | GeForce RTX 3080 Ti | ||
|---|---|---|---|
| 3DMark | |||
| TIme Spy | 17638 | 17681 | 0.243 |
| Time Spy Extreme | 8674 | 9375 | 7.477 |
| Port Royal | 9722 | 12515 | 22.317 |
| Fire Strike | 38279 | 36225 | -5.670 |
| Fire Strike Extreme | 24653 | 22582 | -9.171 |
| Fire Strike Ultra | 13446 | 12320 | -9.140 |
| Ray Tracing | 24.8 | 54.33 | 54.353 |
| 4K Gaming | |||
| Assassin Creed Vahalla | 71 | 62 | -14.516 |
| Borderlands 3 : bad ass (DX11) | 60.72 | 69.32 | 12.406 |
| Borderlands 3 : bad ass (DX12) | 73.39 | 66.44 | -10.460 |
| Control | 57.32 | 63.94 | 10.353 |
| Control RT_High | 25.27 | 39.9 | 36.667 |
| Cyberpunk (Ultra) | 41.64 | 44.29 | 5.983 |
| Cyberpunk (RTUltra+DLSS_off) | 13.58 | 21.69 | 37.390 |
| Dirt 5 | 88.6 | 97.7 | 9.314 |
| Dirt 5(RT) | 73.8 | 77.3 | 4.528 |
| Metro Exouds {Ultra) | 67.76 | 73.38 | 7.659 |
| Metro Exodus Enhancded Edition Ultra preset (RT high) | 41.06 | 54.32 | 24.411 |
| Far Cry 5 (ultra preset) | 109 | 108 | -0.926 |
| Gears 5 | 76.5 | 74.1 | -3.239 |
| Godfall (Epic) | 73 | 73.3 | 0.409 |
| Godfall (RT) | 60 | 65.3 | 8.116 |
| Horizon Zero Dawn | 79 | 90 | 12.222 |
| Shadow of the Tomb Raider (highest) | 88 | 94 | 6.383 |
| Shadow of the Tomb Raider(RT_ULTRA) | 47 | 57 | 17.544 |
| Total War: Troy Ultra : battle | 53.4 | 59 | 9.492 |
| Watch Dog Legion | 56 | 60 | 6.667 |
| Watch Dog Legion(RT_Ultra) | 21 | 33 | 36.364 |
| 1440p | |||
| Assassin Creed Vahalla | 118 | 87 | -35.632 |
| Borderlands 3 : bad ass (DX11) | 110.97 | 120.85 | 8.175 |
| Borderlands 3 : bad ass (DX12) | 132.98 | 115.76 | -14.876 |
| Control | 115.68 | 121.46 | 4.759 |
| Control RT_High | 51.81 | 78.5 | 34 |
| Cyberpunk (Ultra) | 85.38 | 82.13 | -3.957 |
| Cyberpunk (RTUltra+DLSS_off) | 23.85 | 43.73 | 45.461 |
| Dirt 5 | 134.7 | 135.5 | 0.590 |
| Dirt 5(RT) | 112.4 | 119.5 | 5.941 |
| Metro Exodus (Ultra) | 105.15 | 110.85 | 5.142 |
| Metro Exodus Enhancded Edition Ultra preset (RT high) | 75.37 | 89.24 | 15.542 |
| Far Cry 5 (ultra preset) | 145 | 161 | 9.938 |
| Gears 5 | 140.1 | 122.1 | -14.742 |
| Godfall (Epic) | 135.1 | 123 | -9.838 |
| Godfall (RT) | 111.2 | 112.2 | 0.891 |
| Horizon Zero Dawn | 141 | 147 | 4.082 |
| Shadow of the Tomb Raider (highest) | 166 | 161 | -3.106 |
| Shadow of the Tomb Raider(RT_ULTRA) | 87 | 101 | 13.861 |
| Total War: Troy Ultra : battle | 105.9 | 110.3 | 3.989 |
| Watch Dog Legion | 93 | 92 | -1.087 |
| Watch Dog Legion(RT_Ultra) | 39 | 57 | 31.579 |
如果要說 GeForce RTX 3080 Ti 較 AMD Radeon RX 6900 XT 有著更佳的表現,這顯然說不太過去,畢竟兩張卡都互有輸贏,然而碰到 RT 遊戲設定的話,不難發現到有著 2 代 RT Cores 的 GeForce RTX 3080 Ti 較 AMD Radeon RX 6900 XT 更具優勢。
與 GeForce RTX 3080 比較,GeForce RTX 3080 Ti 有著更佳的表現,特別是在遊戲方面。
若和 GeForce RTX 3090 同場較勁的話,12GB GDDR6X 的 GeForce RTX 3080 Ti 似乎還少了些火候,但 2 款顯示卡的 NVIDIA 建議售價差了近 300 USD… 我們很清楚地見到他們的不同之處。
至於 AMD Fidelityfx Super Resolution 會在 6 月 22 日開放,對 NVIDIA 來說也沒什麼好擔憂的,因為對應的 DLSS 技術早已經從 Turing 架構的產品上讓使用者體驗。
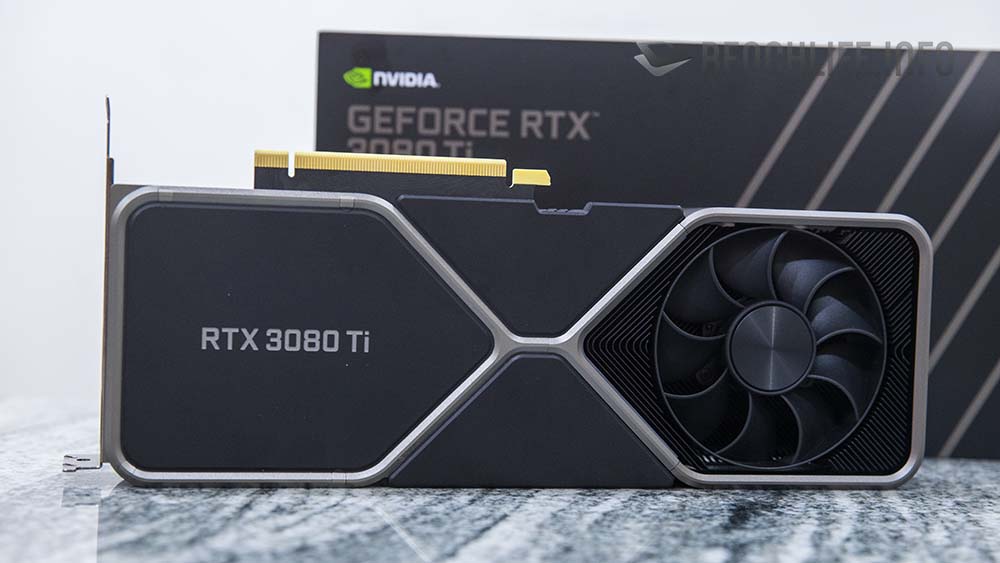
2 代 RT Cores 以及 3 代 Tensor Cores 是 Ampere 架構的要素,顯然對於遊戲來說,這兩項技術有著相當大的幫助;GeForce RTX 3080 Ti 的規格已經相當接近完整版的 GA102 晶片,因此效能表現堪稱 Ampere 架構中的佼佼者,雖然記憶體配置較 GeForce RTX 3090 少,但 4K 遊戲表現顯然足以應付玩家需求。
雖然價格較 GeForce RTX 3080 要貴不少,但與 GeForce RTX 2080 Ti 相比較的話,相同的 1,199 美元售價下,GeForce RTX 3080 Ti 有著更加強大的遊戲體驗,可以說是相當值得入手,前提是要能夠買到…
針對 NVIDIA GeForce RTX 3080 Ti Founders Edition 的測試到此告一段落,下週我們再來了解 GeForce RTX 3070 Ti 的表現。
