
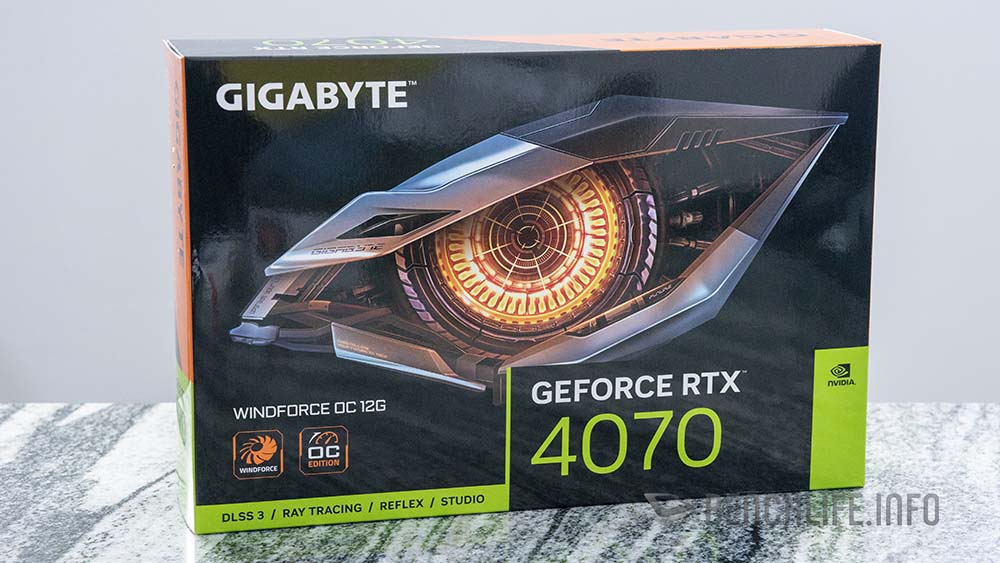
3 風扇設計的 GIGABYTE GeForce RTX 4070 WindForce OC 顯示卡來了。
這次 GeForce RTX 4070 登場,台灣各 AIC 合作夥伴相當給力… 因為陸續收到的 GeForce RTX 4070 顯示卡就讓我們整個清明連假在努力處理這些傢伙… 顯然,各 AIC 合作夥伴以及 NVIDIA 在內,非常重視 GeForce RTX 4070 顯示卡。
接續著 Founders Edition 與 ASUS Dual GeForce RTX 4070 之後,第 3 張我們來看看 GIGABYTE GeForce RTX 4070 WindForce 這款採用 3 風扇設計的顯示卡。
更精確來說,在 GeForce RTX 4070 Founders Edition 和 ASUS Dual GeForce RTX 4070 這 2 張雙風扇設計的散熱器後面,我們要來看看 ASUS、MSI 與 GIGABYTE 等品牌 3 風扇設計的 GeForce RTX GeForce RTX 4070。
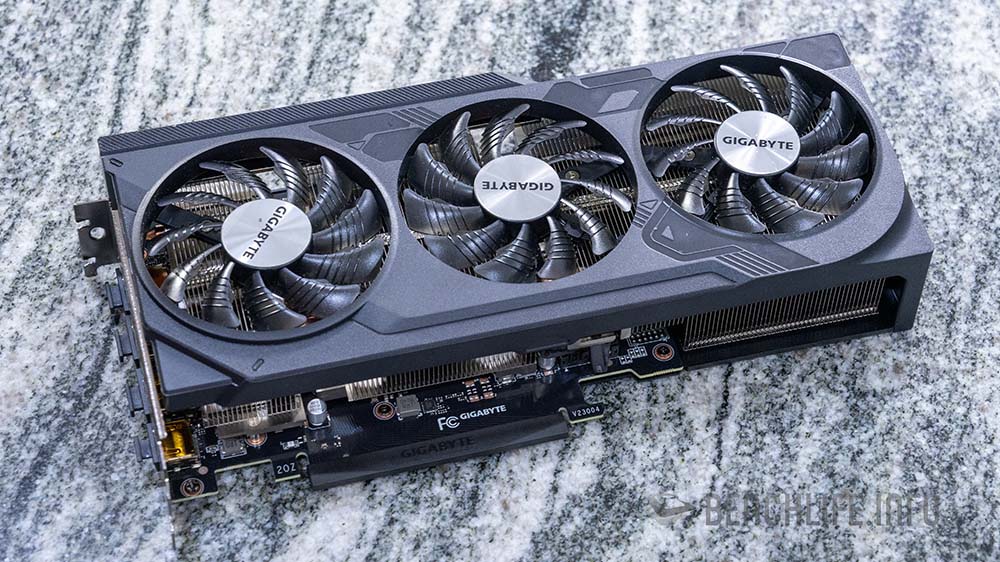
GIGABYTE GeForce RTX 4070 WindForce 顯示卡採用 3 個 8cm 刀鋒造型的風扇,就原廠說法,這獨特的刀鋒造型可以帶來更多的進風量。
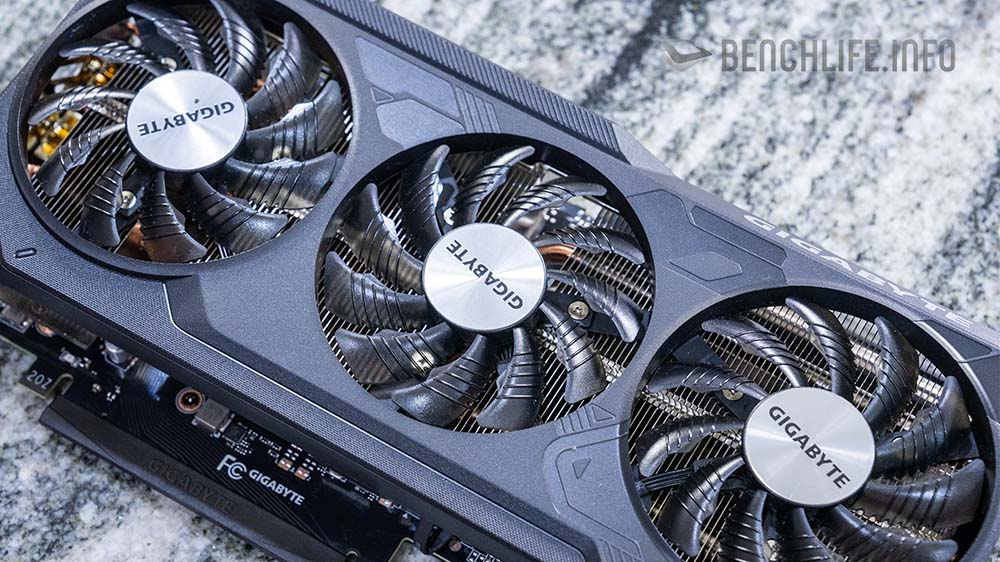
除了獨特的刀鋒造型外,WindForce 散熱器還有正逆轉設計來增加風壓;同時,GIGABYTE WindForce 散熱系統也有 0dBA 停轉功能。
風扇軸承部分,WindForce 使用的是 Sleeve Bearing,但官方稱在搭配奈米石墨烯潤滑油的情況下,WindForce 散熱器風扇軸承的壽命可以與 Dual Ball Bearing 一樣耐用,同時也可以改善 Dual Ball Bearing 聲音較大的問題。
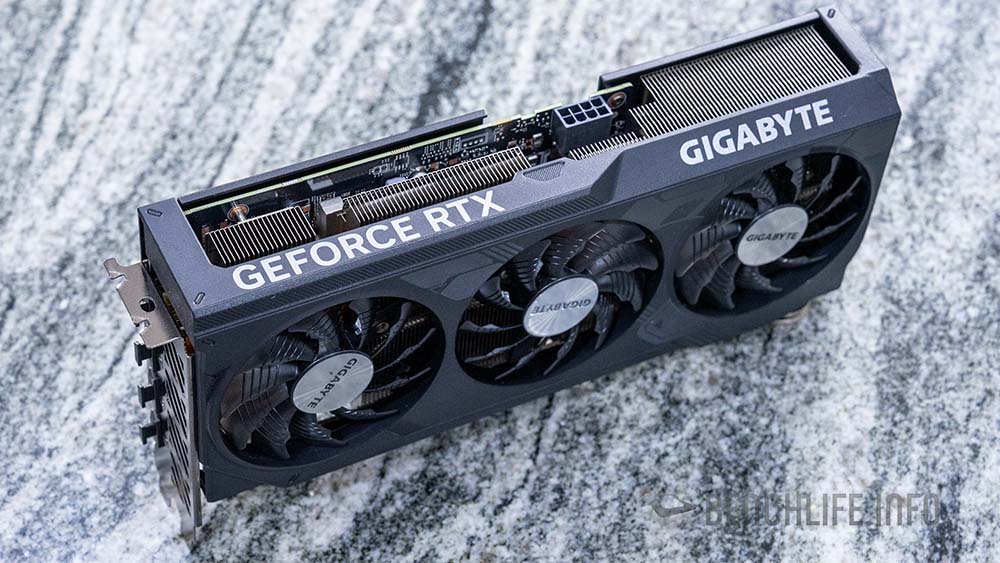
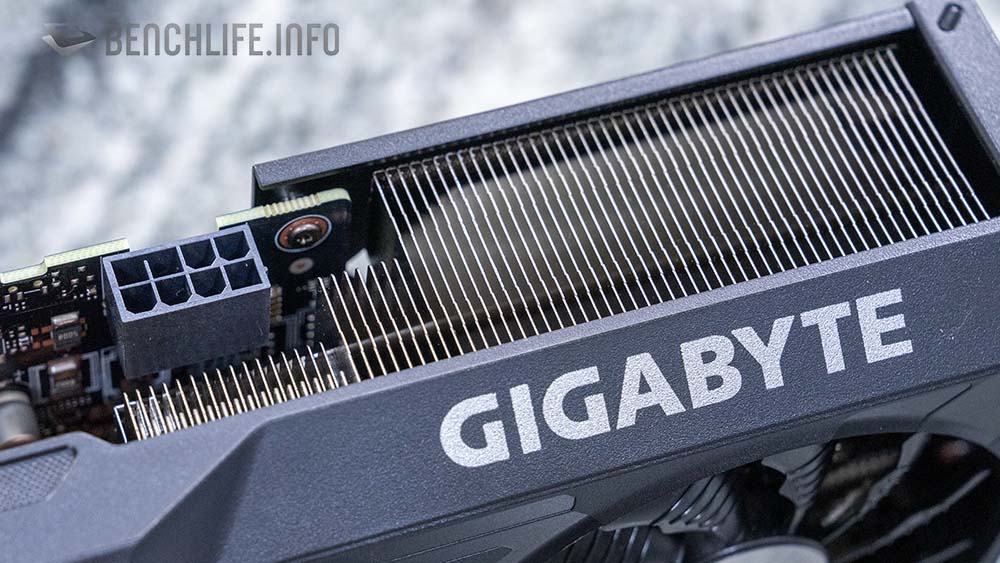
GIGABYTE GeForce RTX 4070 WindForce 採用單 PCIe 8 PIN 供電設計,如果想要找 12VHPWR 接頭的 GIGABYTE GeForce RTX 4070,那就得參考 Gaming 或是白色的 AERO 系列。
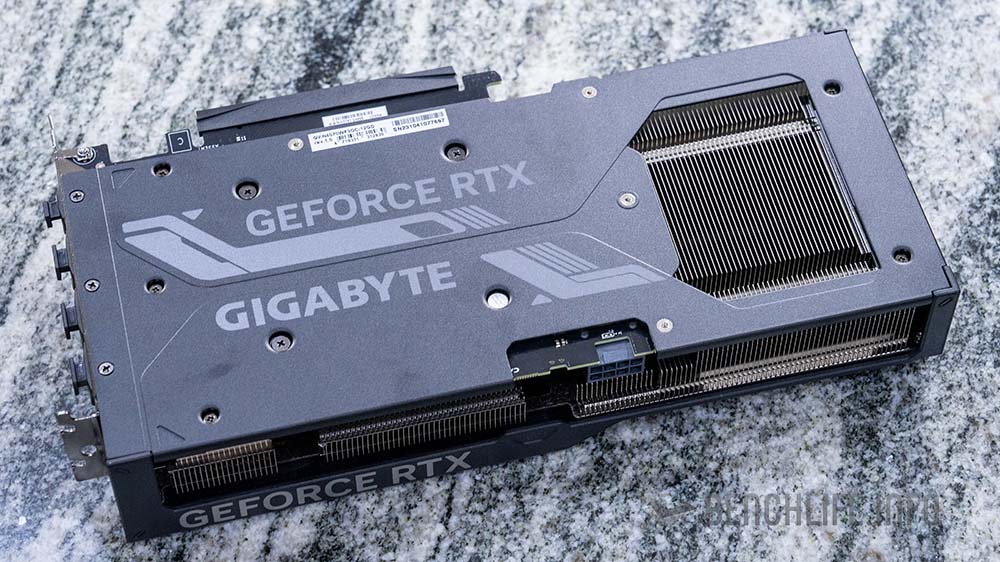
I/O 配置部分 GeForce RTX 4070 WindForce 為 DP|DP|DP|HDM 排列方式,與 GeForce RTX 4070 Founders Edition 相同。
接下來就是看看 3 風扇的 GIGABYTE GeForce RTX 4070 WindForce OC 效能與溫度、散熱表現,由於是 MSRP 版本,當然是要與 GeForce RTX 4070 Founders Edition 比較兩者的差異。
測試平台
CPU – Intel Core i9-13900K
Motherboard – MSI MEG Z790 GodLike
RAM – G.SKILL Trident Z5 DDR5 6000MT/s 16GB x2
3DMark – NVIDIA GeForce RTX 4070 Founders Edition
| 3DMark | GeForce RTX 4070 Founders Edition | GIGABYTE GeForce RTX 4070 WindForce | |
|---|---|---|---|
| TIme Spy | 18829 | 18463 | -1.982% |
| Graphic score | 18135 | 17811 | -1.819% |
| CPU score | 24047 | 23305 | -3.184% |
| Time Spy Extreme | 9055 | 9020 | -0.388% |
| Graphic score | 8556 | 8502 | -0.635% |
| CPU score | 13529 | 13782 | 1.836% |
| Fire Strike | 38350 | 38256 | -0.246% |
| Graphic score | 43760 | 43934 | 0.396% |
| Physics score | 55953 | 55944 | -0.016% |
| Combo score | 14729 | 15656 | 5.921% |
| Fire Strike Extreme | 21207 | 21188 | -0.090% |
| Graphic score | 21340 | 21335 | -0.023% |
| Physics score | 56245 | 55872 | -0.668% |
| Combo score | 10705 | 10688 | -0.159% |
| Fire Strike Ultra | 10413 | 10452 | 0.373% |
| Graphic score | 10001 | 10059 | 0.577% |
| Physics score | 56181 | 56176 | -0.009% |
| Combo score | 5445 | 5424 | -0.387% |
| Port Royal | 11255 | 11130 | -1.123% |
| Ray Tracing | 51.56 | 51.75 | 0.367% |
| Speed Way | 4484 | 4438 | -1.037% |
| DLSS Feature test | |||
| native | 23.16 | 22.95 | -0.915% |
| DLSS 3 | 85.18 | 84.83 | -0.413% |
1440p Gaming – NVIDIA GeForce RTX 4070 Founders Edition
| 1440p | GeForce RTX 4070 Founders Edition | GIGABYTE GeForce RTX 4070 WindForce | |
|---|---|---|---|
| Cyberpunk2077 | 80.35 | 80.51 | 0.199% |
| Cyberpunk2077(RT) | 38.98 | 38.75 | -0.594% |
| Cyberpunk2077(DLSS 3 / DLSS / RSR Quality) | 98.2 | 104.69 | 6.199% |
| F1 22(Ultra) | 75 | 75 | 0.000% |
| F1 22(DLSS 3 / DLSS / FSR) | 152 | 152 | 0.000% |
| Hitman 3 | 187.33 | 185.68 | -0.889% |
| Hitman 3(RT) | 53.74 | 53.88 | 0.260% |
| Hitman 3(DLSS 3 / DLSS / FSR) | 119.43 | 119.31 | -0.101% |
| Portal RTX | 22 | 26.7 | 17.603% |
| Portal RTX(DLSS 3 / DLSS ) | 72.9 | 83.1 | 12.274% |
| Horizon Zero Dawn | 141 | 139 | -1.439% |
| Shadow of the Tomb Raider | 163 | 162 | -0.617% |
| Tom Clancy's Rainbow Six Siege | 508 | 507 | -0.197% |
| Borderlands 3 | 105.76 | 107.79 | 1.883% |
| Total Wars Three Kingdom | 90.7 | 90.8 | 0.110% |
| Metro Exodus | 102.27 | 102.23 | -0.039% |
1080p Gaming – NVIDIA GeForce RTX 4070 Founders Edition
| 1080p | GeForce RTX 4070 Founders Edition | GIGABYTE GeForce RTX 4070 WindForce | |
|---|---|---|---|
| Cyberpunk2077 | 126.64 | 126.61 | -0.024% |
| Cyberpunk2077(RT) | 63.09 | 62.34 | -1.203% |
| Cyberpunk2077(DLSS 3 / DLSS / RSR Quality) | 165.91 | 167.5 | 0.949% |
| F1 22(Ultra) | 110 | 107 | -2.804% |
| F1 22(DLSS 3 / DLSS / FSR) | 207 | 207 | 0.000% |
| Hitman 3 | 280.23 | 279.07 | -0.416% |
| Hitman 3(RT) | 81.93 | 81.79 | -0.171% |
| Hitman 3(DLSS 3 / DLSS / FSR) | 171.35 | 171.7 | 0.204% |
| Portal RTX | 47 | 46.7 | -0.642% |
| Portal RTX(DLSS 3 / DLSS ) | 137.2 | 135 | -1.630% |
| Horizon Zero Dawn | 182 | 181 | -0.552% |
| Shadow of the Tomb Raider | 238 | 236 | -0.847% |
| Tom Clancy's Rainbow Six Siege | 704 | 686 | -2.624% |
| Borderlands 3 | 156.4 | 152.83 | -2.336% |
| Total Wars Three Kingdom | 143.3 | 143.5 | 0.139% |
| Metro Exodus | 127.89 | 128.44 | 0.428% |
Creator – NVIDIA GeForce RTX 4070 Founders Edition
| Creator | GeForce RTX 4070 Founders Edition | GIGABYTE GeForce RTX 4070 WindForce | |
|---|---|---|---|
| Blender | |||
| Monster | 3086 | 3105 | 0.612% |
| Junk Store | 1508 | 1510 | 0.132% |
| classroom | 1519 | 1512 | -0.463% |
| Vray | |||
| GPU | 2606 | 2625 | 0.724% |
| Pugetbench DaviniCi | |||
| Extended Overall | 2233 | 2165 | -3.141% |
| Standard Overall | 2440 | 2353 | -3.697% |
| 4K Media Score | 175 | 175 | 0.000% |
| 8K Media | 161 | 160 | -0.625% |
| GPU Effects Score | 129 | 128 | -0.781% |
| Fusion Score | 428 | 403 | -6.203% |
| Pugetbench Premiere Pro | |||
| Extended overall score | 1080 | 1080 | 0.000% |
| Standard overall score | 1192 | 1186 | -0.506% |
| Extended export score | 123.3 | 123.1 | -0.162% |
| Extended live playback | 87.8 | 89 | 1.348% |
| Standar Export Score | 137.3 | 137.1 | -0.146% |
| Standar Live Playback Score | 107.3 | 105.9 | -1.322% |
| Effects Score | 113 | 111.9 | -0.983% |
| GPU score | 102 | 102.9 | 0.875% |
| Stable Diffusion | |||
| 768x768 batch cout 10(it/s) | 4.07 | 4.13 | 1.453% |
| Omniverse Create Viewport(DLSS 3 / DLSS) | |||
| 2K / DLSS Quality | |||
| Campfire(FPS) | 38.81 | 38.71 | -0.258% |
| Flowers4(FPS) | 36.3 | 37.35 | 2.811% |
| incense (FPS) | 44.12 | 43.16 | -2.224% |
| Jade Tiger (FPS) | 30.7 | 31.42 | 2.292% |
| Warehouse(FPS) | 23.16 | 23.38 | 0.941% |
效能表現方面,可以見到 GIGABYTE GeForce RTX 4070 WindForce OC 在 1440p 解析度下的遊戲測試中,Cyberpunk2077 DLSS 3、Portal RTX 以及 Portal RTX DLSS 3 表現都是明顯領先 Founders Edition,其他與部分遊戲的差異基本可以無視。
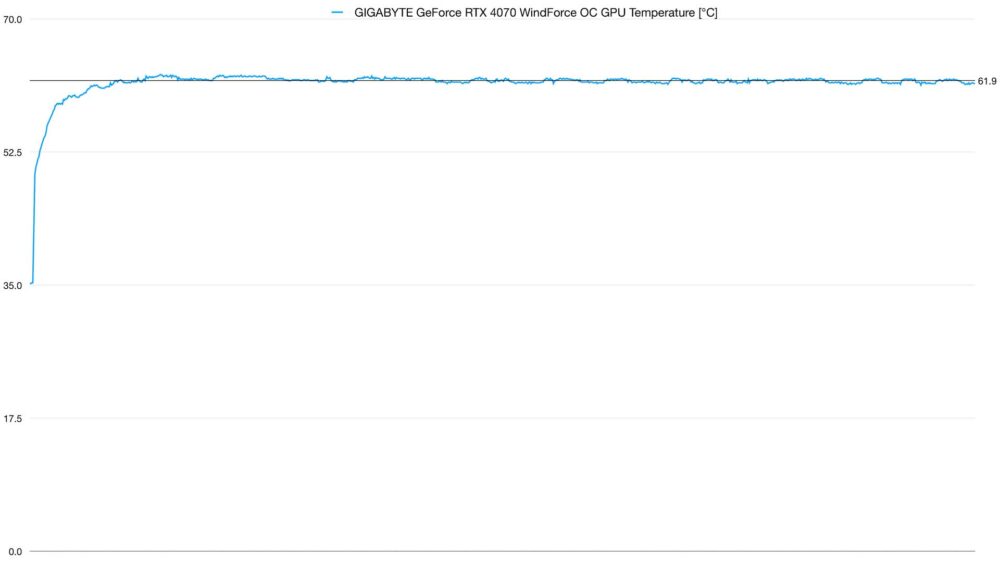
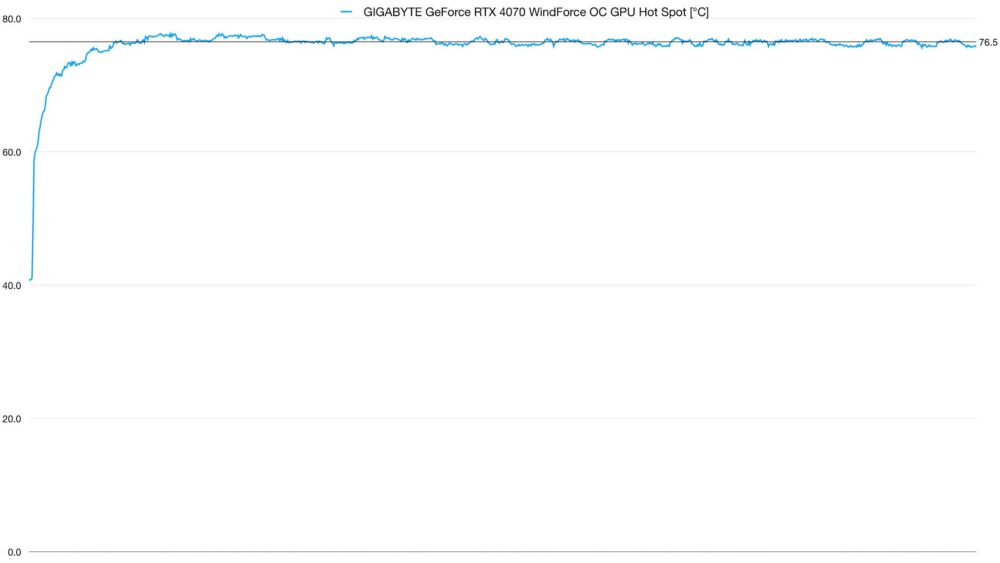
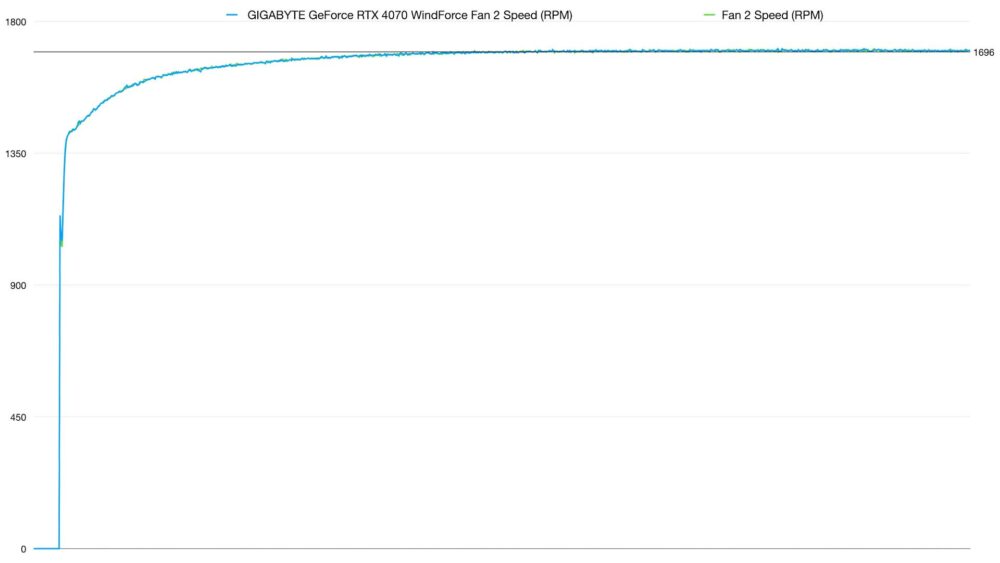
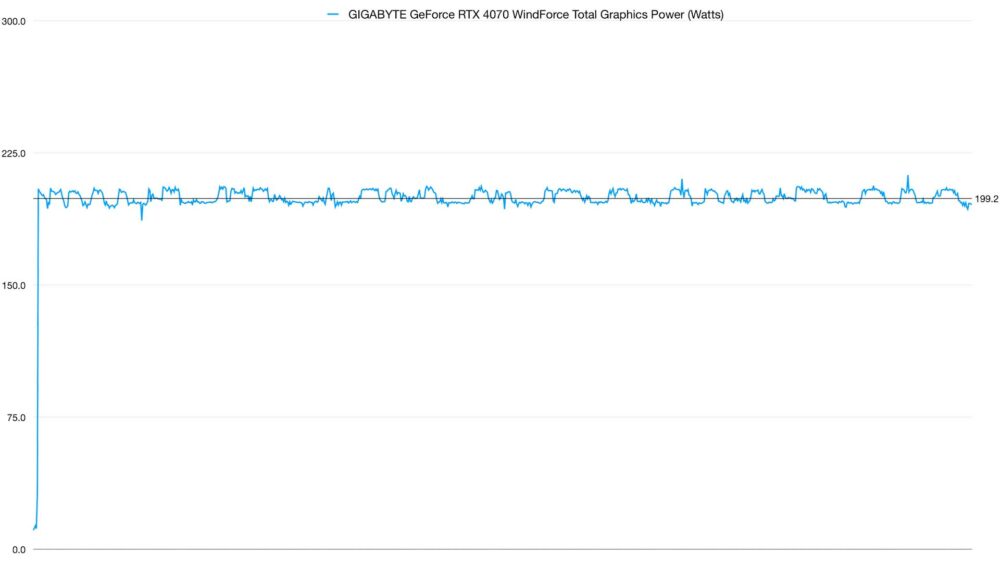
溫度表現方面,3 風扇設計的 GIGABYTE GeForce RTX 4070 WindForce OC 平均在 61.9°C(Hot Spot 為 76.5°C),風扇轉速在 1696 R.P.M;至於這張 GeForce RTX 4070 顯示卡平均 TGP 在 Furmark 測試條件下會來到 199.2W 的中間值。
與 2 槽設計的 NVIDIA GeForce RTX 4070 Founders Edition 相比較的話:
GPU TEMP – 64.4 vs 61.9,Δ 2.5°C;
GPU Hot Spot – 76.8 vs 76.5,Δ 0.3°C;
FANS – 1614 vs 1696,Δ 82 R.P.M;
TGP – 191.2 vs 199.2,Δ 8W;
GIGABYTE GeForce RTX 4070 WindForce OC 相較於 Founders Edition,在效能方面可能沒有那麼明顯差異,不過在溫度表現方面,可以見到 3 風扇的 GeForce RTX 4070 WindForce OC 在 199W 的 TGP 條件下,表現要較 Founders Edition 佳。
顯然,這款顯示卡在風扇轉速部分的數值偏高(應該是我們手上顯示卡最高的一張),但好在測試過程中並沒有聽到明顯的聲音(裸測),因此使用者裝進機殼後,想必機殼更能有效阻隔風扇轉速帶來的聲音。
作為 MSRP 的選項之一,維持單 PCIe 8 PIN 供電設計的 GeForce RTX 4070 WindForce OC 顯示卡可能會吸引到不少消費者的注意。
NVIDIA GeForce RTX 4070 實測
- 1. NVIDIA GeForce RTX 4070 Founders Edition
2. ASUS Dual GeForce RTX 4070
3. GIGABYTE GeForce RTX 4070 WindForce OC
4. MSI GeForce RTX 4070 Gaming X Trio
5. ASUS TUF Gaming GeForce RTX 4070