Intel Arc A770 與 Arc A750 來了,心動那就要等到 10 月 12 日。
獨立顯示卡這條路,應該是 Intel 在 PC 領域的最後一塊拼圖,即使我們見到 Intel 已經將儲存賣給 SK Hynix,短期內不會再有任何 Intel Logo 的 SSD 出現在市場上。
DG1 這款產品也許不夠成熟,但在某個程度上,它可算是 Intel 第一款推出市場的獨立顯示卡,而我們覺得 Alchemist 架構的 Intel Arc A 系列獨立顯示卡才是 Intel 這個 x86 架構龍頭回應整個獨立顯示卡市場的第一款產品。
Intel Alchemist 架構提供了 A310、A380、A580、A750 與 Intel Arc A770 在內的 5 款產品,其中 Intel Arc A380 已經開始在中國、美國以及一些特定市場販售。
至於 Intel Arc A750 與 Intel Arc A770 則會從 10 月 12 日正式在市場上推出。
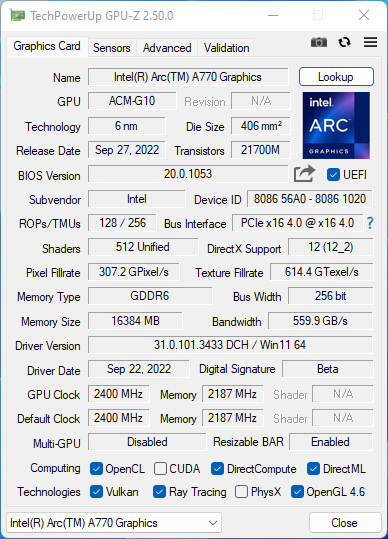
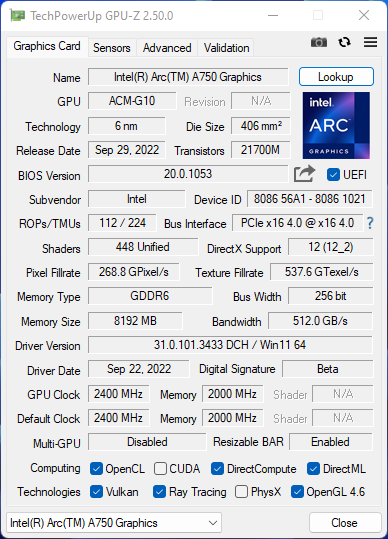
Intel 也提供了 Intel Arc A750 與 Intel Arc A770 Limited Edition 讓我們進行測試。
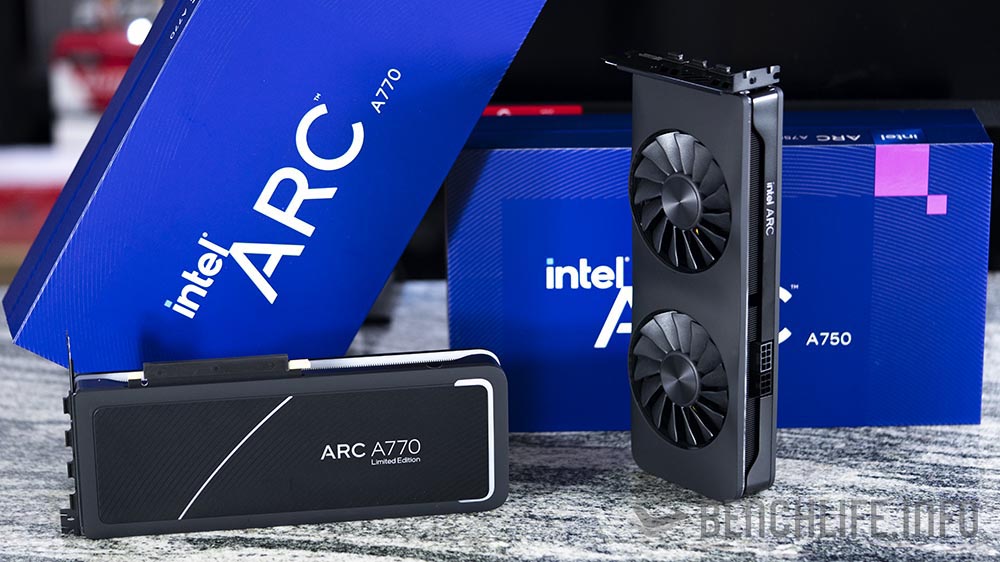
在正式推出之前,網路上各種風風雨雨傳出 Intel 打算放棄獨立顯示卡這條路,但就我們所知道的 Intel 已經將 Arc 系列獨立顯示卡的規劃從 Alchemist、Battlemage 安排至 Celestian,如果以時間軸來看的話,這產品規劃已經延伸至 2025 年以後。
更重要的是,我們認知 Intel Arc 獨立顯示卡只是 Intel 在整個 GPU 規劃中的其中一塊,其他的包含 HPC 以及 Notebook 市場,都是 Intel 相當重要的收入來源。若能成功從 NVIDIA 手中獲取一些佔有率,那麼對 Intel 整體營收可以說是有相當大的幫助,然而這有一個前提,那就是 Intel 必須準時將產品推出市場,不能如 Sapphire Rapids 或是其他產品般一推再推…
無論如何,Intel Arc 並沒有如傳聞中被取消,雖然遲了點,但它終究還是與大家見面。
| A380 | A580 | A750 | A770 8GB | A770 16GB | |
|---|---|---|---|---|---|
| Xe Cores | 8 | 24 | 28 | 32 | 32 |
| Ray Tracing Units | 8 | 24 | 28 | 32 | 32 |
| Graphics Cores(MHz) | 2000 | 1700 | 2050 | 2100 | 2100 |
| Memory(GDDR6) | 6GB | 8GB | 8GB | 8GB | 16GB |
| Memory Bandwidth(up to) | 186 GB/s | 512 GB/s | 512 GB/s | 512GB/s | 560GB/s |
| TBP(Watts) | 75W | 175W | 225W | 225W | 225W |
Intel Arc A750 Limited Edition 與 Intel Arc A770 Limited Edition 的 TBP(Total Board Power)都是 225W 設定,以 Intel 的資料來看,他們分別對應到 NVIDIA GeForce RTX 3060,但我們更認為 Intel Arc A770 的實力應該可以上看 GeForce RTX 3060 Ti 或是 GeForce RTX 3070,不過這我們這裡只會使用 GeForce RTX 3060 進行比較。
3DMark –
Intel Arc A770 Limited Edition;
Intel Arc A750 Limited Edition;
GIGABYTE GeForce RTX 3060 EAGLE OC;
| 3DMark | GIGABYTE GeForce RTX 3060 Eagle OC | Intel Arc A770 Limited Edition | |
|---|---|---|---|
| TIme Spy | 9549 | 13873 | 31.168% |
| Graphic score | 8727 | 13213 | 33.951% |
| CPU score | 20489 | 19356 | -5.583% |
| Time Spy Extreme | 4484 | 6668 | 32.753% |
| Graphic score | 4106 | 6366 | 35.501% |
| CPU score | 9402 | 9110 | -3.205% |
| Fire Strike | 21888 | 30421 | 28.050% |
| Graphic score | 22546 | 33874 | 33.442% |
| Physics score | 42106 | 40335 | -4.391% |
| Combo score | 11289 | 14261 | 20.840% |
| Fire Strike Ultra | 10412 | 15333 | 32.094% |
| Graphic score | 10495 | 15804 | 33.593% |
| Physics score | 41716 | 37757 | -10.485% |
| Combo score | 4767 | 7254 | 34.285% |
| Fire Strike Extreme | 5316 | 7495 | 29.072% |
| Graphic score | 5098 | 7129 | 28.489% |
| Physics score | 39026 | 39731 | 1.774% |
| Combo score | 2694 | 4094 | 34.196% |
| Port Royal | 5095 | 6945 | 26.638% |
| Ray Tracing | 19.53 | 32.15 | 39.253% |
| 3DMark | GIGABYTE GeForce RTX 3060 Eagle OC | Intel Arc A750 Limited Edition | |
|---|---|---|---|
| TIme Spy | 9549 | 13080 | 26.995% |
| Graphic score | 8727 | 12451 | 29.909% |
| CPU score | 20489 | 18332 | -11.766% |
| Time Spy Extreme | 4484 | 6402 | 29.959% |
| Graphic score | 4106 | 6079 | 32.456% |
| CPU score | 9402 | 9165 | -2.586% |
| Fire Strike | 21888 | 27502 | 20.413% |
| Graphic score | 22546 | 30686 | 26.527% |
| Physics score | 42106 | 36909 | -14.081% |
| Combo score | 11289 | 12730 | 11.320% |
| Fire Strike Ultra | 10412 | 14253 | 26.949% |
| Graphic score | 10495 | 14590 | 28.067% |
| Physics score | 41716 | 38970 | -7.046% |
| Combo score | 4767 | 6710 | 28.957% |
| Fire Strike Extreme | 5316 | 6896 | 22.912% |
| Graphic score | 5098 | 6532 | 21.953% |
| Physics score | 39026 | 39097 | 0.182% |
| Combo score | 2694 | 3797 | 29.049% |
| Port Royal | 5095 | 6572 | 22.474% |
| Ray Tracing | 19.53 | 28.8 | 32.188% |
XeSS –
Intel Arc A770 Limited Edition;
Intel Arc A750 Limited Edition;
| Intel XeSS Feature Test | Intel Arc A750 Limited Edition | Intel Arc A770 Limited Edition | |
|---|---|---|---|
| Ultra Quality | 41.74 | 43.84 | 4.790% |
| Quality | 50.86 | 53.12 | 4.255% |
| Balenced | 58.41 | 61.2 | 4.559% |
| Performance | 68.16 | 71.06 | 4.081% |
| off | 27.64 | 29.34 | 5.794% |
1080p Gaming –
Intel Arc A770 Limited Edition;
Intel Arc A750 Limited Edition;
GIGABYTE GeForce RTX 3060 EAGLE OC;
| 1080p | GIGABYTE GeForce RTX 3060 Eagle OC | Intel Arc A770 Limited Edition | |
|---|---|---|---|
| Assassin Creed Vahalla | 74 | 75 | 1.333% |
| Borderlands 3 : bad ass | 75.93 | 90.52 | 16.118% |
| Cyberpunk2077 | 51.68 | 61.64 | 16.158% |
| Cyberpunk2077 +RT | 30.55 | 30.21 | -1.125% |
| Tom Clancy’s The Division 2 | 84 | 95 | 11.579% |
| Metro Exodus(Ultra) | 67.34 | 84.63 | 20.430% |
| Metro Exodus(RT_high) | 55.36 | 69.93 | 20.835% |
| F1 2022 (Ultra ) | 57 | 52 | -9.615% |
| Far Cry 6 | 95 | 94 | -1.064% |
| Far Cry 6 RT | 78 | 77 | -1.299% |
| Horizon Zero Dawn | 103 | 95 | -8.421% |
| Hitman3(Max Settings) | 153.46 | 176.74 | 13.172% |
| Hitman3 (RT) | 41.88 | 51.34 | 18.426% |
| Hitman3 (XeSS Performance, DLSS UltraPerformance) | 98.19 | 87.58 | -12.115% |
| Shadow of the Tomb Raider (highest) | 130 | 125 | -4.000% |
| Shadow of the Tomb Raider(RT_ULTRA) | 97 | 84 | -15.476% |
| Shadow of the Tomb Raider(RT_ULTRA ,DLSS_UP) | 148 | 108 | -37.037% |
| Total War: Troy | 103.3 | 119.9 | 13.845% |
| The Diofiled Chronicle (Max Settings, RT) | 98 | 93 | -5.376% |
| The Diofiled Chronicle (XeSS Performance, DLSS UltraPerformance) | 145 | 144 | -0.694% |
| Watch Dog Legion (Ultra) | 65 | 76 | 14.474% |
| Watch Dog Legion(RT_High) | 41 | 48 | 14.583% |
| 1080p | GIGABYTE GeForce RTX 3060 Eagle OC | Intel Arc A750 Limited Edition | |
|---|---|---|---|
| Assassin Creed Vahalla | 74 | 67 | -10.448% |
| Borderlands 3 : bad ass | 75.93 | 85.47 | 11.162% |
| Cyberpunk2077 | 51.68 | 50.12 | -3.113% |
| Cyberpunk2077 +RT | 30.55 | 27.11 | -12.689% |
| Tom Clancy’s The Division 2 | 84 | 89 | 5.618% |
| Metro Exodus(Ultra) | 67.34 | 80.3 | 16.139% |
| Metro Exodus(RT_high) | 55.36 | 66.88 | 17.225% |
| F1 2022 (Ultra ) | 57 | 48 | -18.750% |
| Far Cry 6 | 95 | 89 | -6.742% |
| Far Cry 6 RT | 78 | 72 | -8.333% |
| Horizon Zero Dawn | 103 | 89 | -15.730% |
| Hitman3(Max Settings) | 153.46 | 166.35 | 7.749% |
| Hitman3 (RT) | 41.88 | 48.51 | 13.667% |
| Hitman3 (XeSS Performance, DLSS UltraPerformance) | 98.19 | 82.29 | -19.322% |
| Shadow of the Tomb Raider (highest) | 130 | 116 | -12.069% |
| Shadow of the Tomb Raider(RT_ULTRA) | 97 | 65 | -49.231% |
| Shadow of the Tomb Raider(RT_ULTRA ,DLSS_UP) | 148 | 87 | -70.115% |
| Total War: Troy | 103.3 | 111 | 6.937% |
| The Diofiled Chronicle (Max Settings, RT) | 98 | 90 | -8.889% |
| The Diofiled Chronicle (XeSS Performance, DLSS UltraPerformance) | 145 | 143 | -1.399% |
| Watch Dog Legion (Ultra) | 65 | 65 | 0 |
| Watch Dog Legion(RT_High) | 41 | 31 | -32.258% |
1440p Gaming –
Intel Arc A770 Limited Edition;
Intel Arc A750 Limited Edition;
GIGABYTE GeForce RTX 3060 EAGLE OC;
| 1440p | GIGABYTE GeForce RTX 3060 Eagle OC | Intel Arc A750 Limited Edition | |
|---|---|---|---|
| Assassin Creed Vahalla | 57 | 58 | 1.724% |
| Borderlands 3 : bad ass | 53.2 | 61.64 | 13.692% |
| Cyberpunk2077 | 41.77 | 43.03 | 2.928% |
| Cyberpunk2077 +RT | 18.69 | 12.53 | -49.162% |
| Tom Clancy’s The Division 2 | 58 | 64 | 9.375% |
| Metro Exodus(Ultra) | 53.09 | 65.7 | 19.193% |
| Metro Exodus(RT_high) | 40.47 | 50.4 | 19.702% |
| F1 2022 (Ultra ) | 37 | 34 | -8.824% |
| Far Cry 6 | 71 | 70 | -1.429% |
| Far Cry 6 RT | 60 | 58 | -3.448% |
| Horizon Zero Dawn | 80 | 73 | -9.589% |
| Hitman3(Max Settings) | 96.74 | 112.62 | 14.101% |
| Hitman3 (RT) | 26.73 | 31.88 | 16.154% |
| Hitman3 (XeSS Performance, DLSS UltraPerformance) | 75.3 | 64.27 | -17.162% |
| Shadow of the Tomb Raider (highest) | 88 | 84 | -4.762% |
| Shadow of the Tomb Raider(RT_ULTRA) | 50 | 49 | -2.041% |
| Shadow of the Tomb Raider(RT_ULTRA ,DLSS_UP) | 117 | 71 | -64.789% |
| Total War: Troy | 76.9 | 82.3 | 6.561% |
| The Diofiled Chronicle (Max Settings, RT) | 63 | 56 | -12.500% |
| The Diofiled Chronicle (XeSS Performance, DLSS UltraPerformance) | 125 | 120 | -4.167% |
| Watch Dog Legion | 49 | 51 | 3.922% |
| Watch Dog Legion(RT_Ultra) | 29 | 17 | -70.588% |
| 1440p | GIGABYTE GeForce RTX 3060 Eagle OC | Intel Arc A770 Limited Edition | |
|---|---|---|---|
| Assassin Creed Vahalla | 57 | 62 | 8.065% |
| Borderlands 3 : bad ass | 53.2 | 65.72 | 19.051% |
| Cyberpunk2077 | 41.77 | 46.39 | 9.959% |
| Cyberpunk2077 +RT | 18.69 | 19.64 | 4.837% |
| Tom Clancy’s The Division 2 | 58 | 69 | 15.942% |
| Metro Exodus(Ultra) | 53.09 | 69.2 | 23.280% |
| Metro Exodus(RT_high) | 40.47 | 53.03 | 23.685% |
| F1 2022 (Ultra ) | 37 | 35 | -5.714% |
| Far Cry 6 | 71 | 73 | 2.740% |
| Far Cry 6 RT | 60 | 64 | 6.250% |
| Horizon Zero Dawn | 80 | 79 | -1.266% |
| Hitman3(Max Settings) | 96.74 | 118.36 | 18.266% |
| Hitman3 (RT) | 26.73 | 33.95 | 21.267% |
| Hitman3 (XeSS Performance, DLSS UltraPerformance) | 75.3 | 69.62 | -8.159% |
| Shadow of the Tomb Raider (highest) | 88 | 93 | 5.376% |
| Shadow of the Tomb Raider(RT_ULTRA) | 50 | 59 | 15.254% |
| Shadow of the Tomb Raider(RT_ULTRA ,DLSS_UP) | 117 | 87 | -34.483% |
| Total War: Troy | 76.9 | 92.8 | 17.134% |
| The Diofiled Chronicle (Max Settings, RT) | 63 | 60 | -5.000% |
| The Diofiled Chronicle (XeSS Performance, DLSS UltraPerformance) | 125 | 126 | 0.794% |
| Watch Dog Legion | 49 | 58 | 15.517% |
| Watch Dog Legion(RT_Ultra) | 29 | 34 | 14.706% |
使用 Intel Core i9-12900K 處理器,我們來看看 3 張顯示卡在 Latency、1% Low FPS 與 FPS 在 Fornite 遊戲的 1080p 和 1440p 的表現。
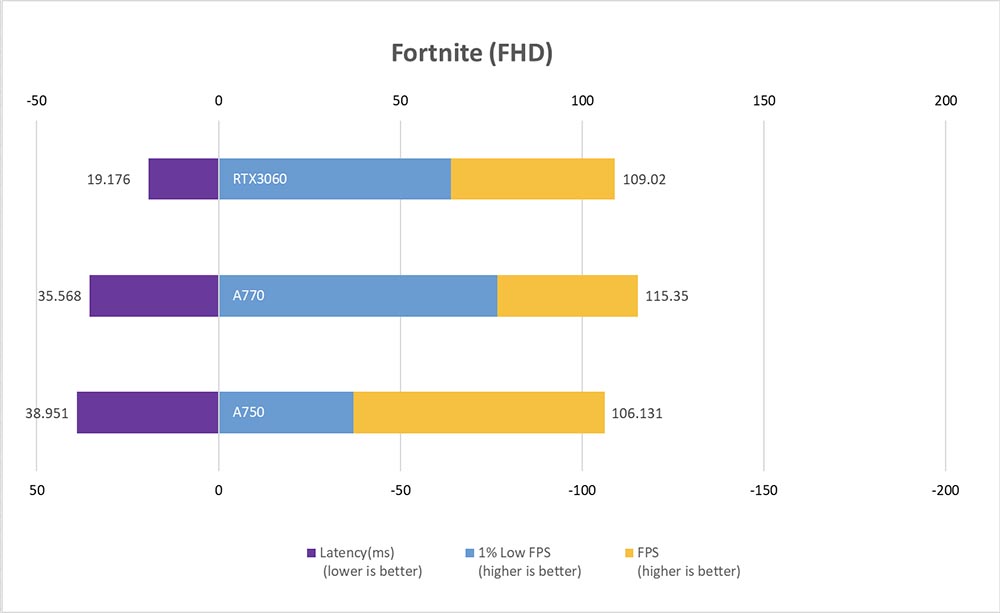
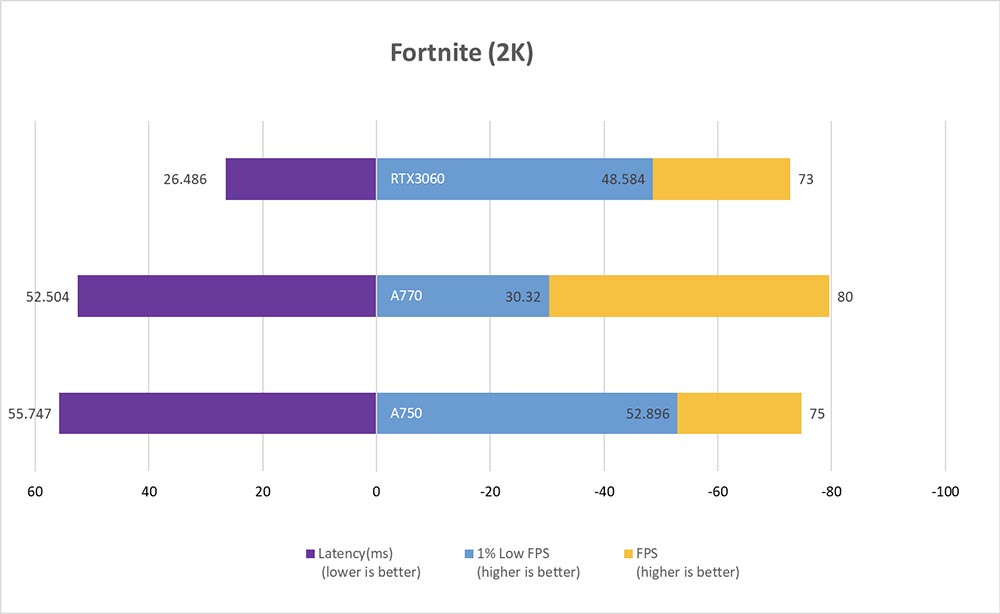
NVIDIA GeForce RTX 3060 的 Latency 表現是 3 張顯示卡最佳的;另一方面, 1% Low FPS 方面則是可以見到 Intel Arc A770 在 2K 解析度部分有著相當優異的表現。
首先,Intel Arc 顯示卡的驅動在我們測試中有出現一些怪現象,但中間也有更新一版改善問題,因此我們相信,未來的驅動更新將會提升 Intel Arc 獨立顯示卡的效能表現。
Intel Arc A750 在 3DMark 的表現其實是領先 GeForce RTX 3060,然而遊戲表現則落後於 GeForce RTX 3060,這部分原因就如前面提到,顯示卡驅動的調教並沒有如想像中完善所致。原則上,Intel Arc A750 要與 NVIDIA GeForce RTX 3060 抗衡是沒有太大問題。
至於 Intel Arc A770 方面,我們認為若驅動調教更完善的話,要與 GeForce RTX 3060 Ti 抗衡,並不會有什麼大問題。
XeSS 方面,Intel Arc A770 與 Intel Arc A750 的差距只有 5%。
全名為 Xe Super Sampling 的 Intel XeSS 技術其實與 NVIDIA 的 DLSS 相似,透過 AI 運算能力將較低畫質提升至高畫質的處理,雖然 AMD Fidelity FX Super Resolution(FSR)也有著類似特色,但它並不透過 AI 運算。
換句話,Intel Arc A 系列顯示卡在某些情況下,是可以相容支援 NVIDIA DLSS 技術的遊戲,這樣的前提下對 Intel 獨立顯示卡來說是件好事情,在驅動更完善的情況下,可以讓使用者有著更佳的遊戲體驗。
對於 Alchemist 架構的 Intel Arc A 系列獨立顯示卡,確實有讓我們特別的關注(某些情況下),現在正式推出之後,後續我們要關注的是合作夥伴的產品是否能吸引到消費者的注意,特別是 ASUS、GIGABYTE 與 MSI 都有 NVIDIA 與 AMD 的包袱在,推出 Intel Arc 系列顯示卡勢必在內部會引發各種討論。
Intel 缺乏 ASUS、GIGABYTE 與 MSI 的加持下,單獨靠著 Colorful 轉投資的 Gunnir 是無法將 Intel 獨立顯示卡市場的聲浪擴大。
獨立顯示卡之後,Intel Arc 顯示卡的下一步棋就是搶攻由 NVIDIA GeForce 霸佔許久的筆記型電腦市場,我們相信在驅動更完善的前提下,Intel Arc 的表現應該會讓更多玩家滿意。