
MSI GeForce RTX 4070 Gaming X Trio 的表現讓人驚艷,繼續看下去吧。
4 月 12 日看完符合 NVIDIA MSRP 的 GeForce RTX 4070 之後,緊接著在 4 月 13 日我們繼續來看看 GeForce RTX 4070 顯示卡。
過去,我們比較少見測試 MSI 顯示卡,但未來 MSI 也會繼續在我們測試名單中出現。
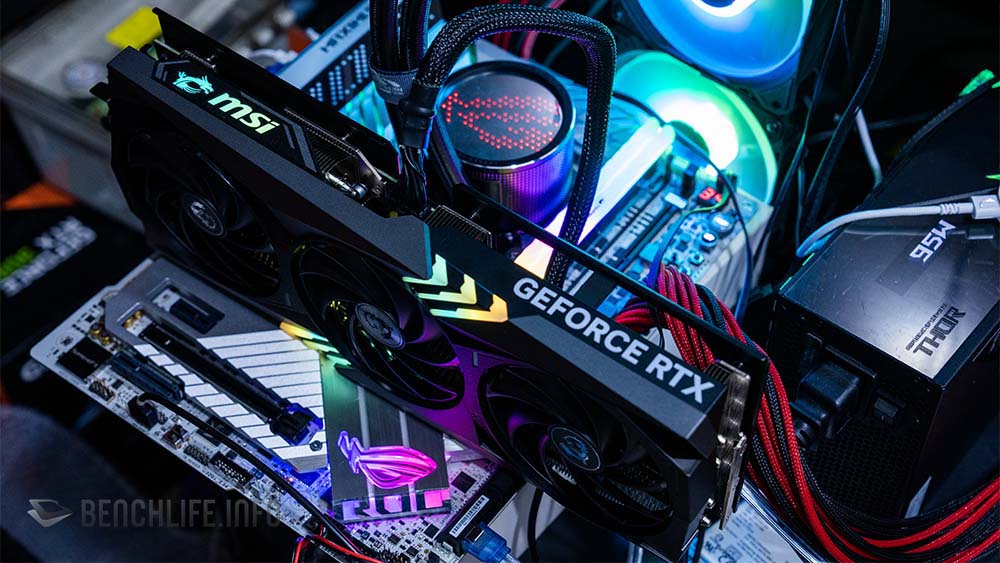
這次收到的 MSI GeForce RTX 4070 為 Gaming Trio 系列,因為是超頻版本,所以全名是 GeForce RTX 4070 Gaming X Trio,是一款採用 3 風扇設計的 GeForce RTX 4070 顯示卡。好像,MSI GeForce RTX 4070 Gaming X Trio 顯示卡也是我們這次收到的系列顯示卡中,體積最大的一張。
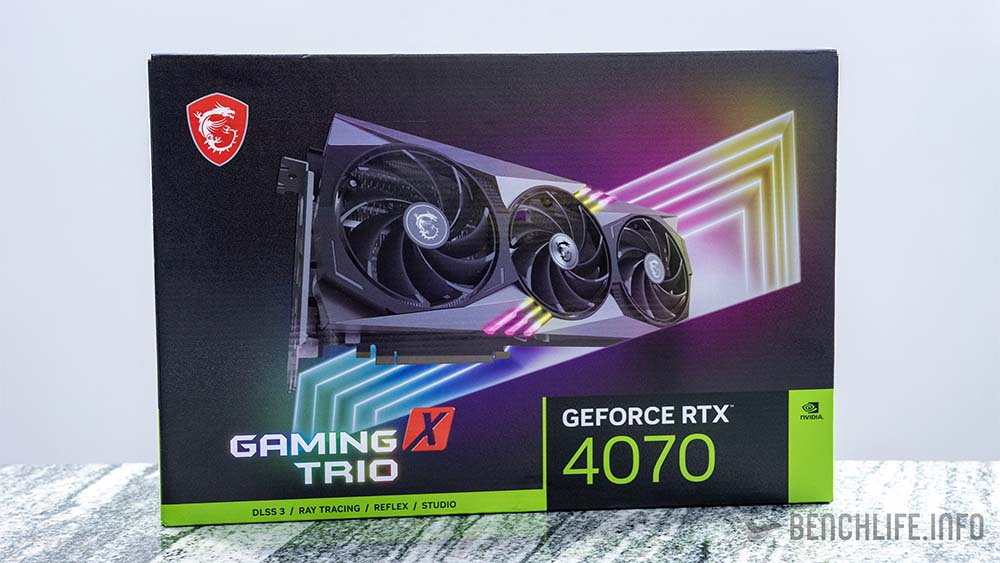
在 Gaming Trio 之上,還有 Suprim 系列,而下面則是有 Ventus 3X 與 Ventus 2X 存在著,滿足不同需求與導向的使用者。
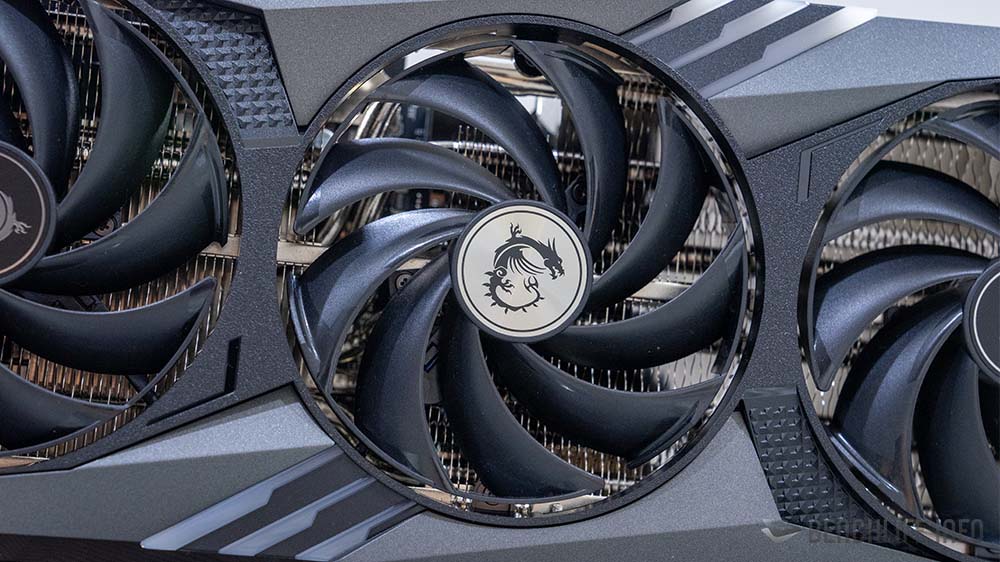
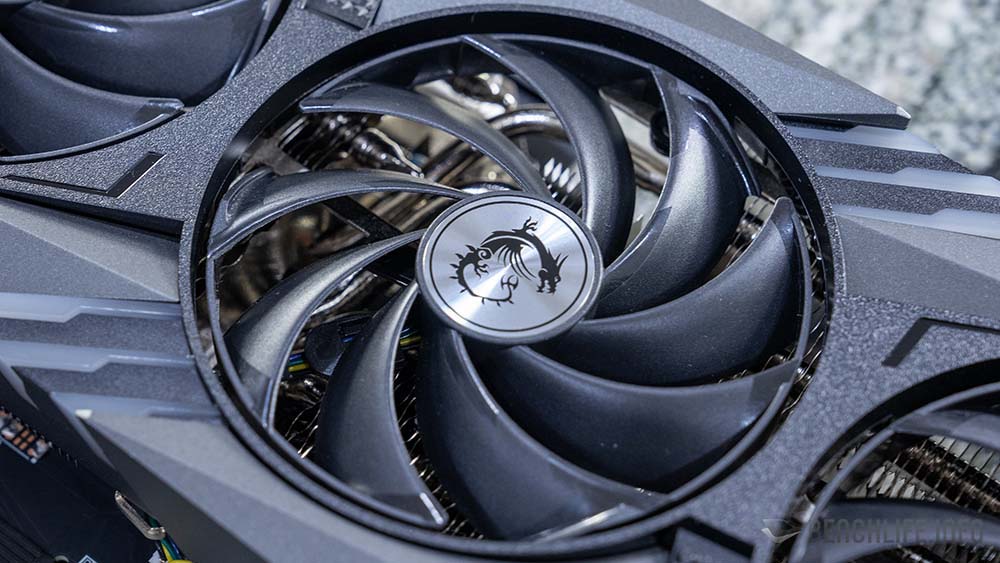
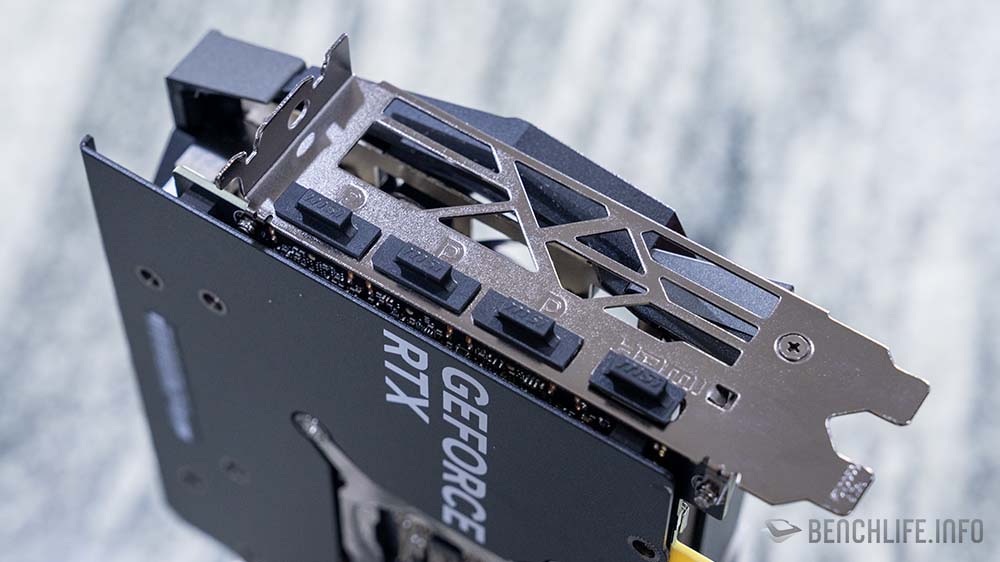
MSI GeForce RTX 4070 Gaming X Trio 採用 Tri Frozr 3 散熱設計,搭配上強化風流與風壓表現的 TORX Fan 5.0 風扇,再加上波浪 2.0 散熱鰭片改善風流,用以提升整體散熱效果。TORX FAN 5.0 部分採用 Dual Ball Bearing,其壽命與穩定度無庸置疑。
FE
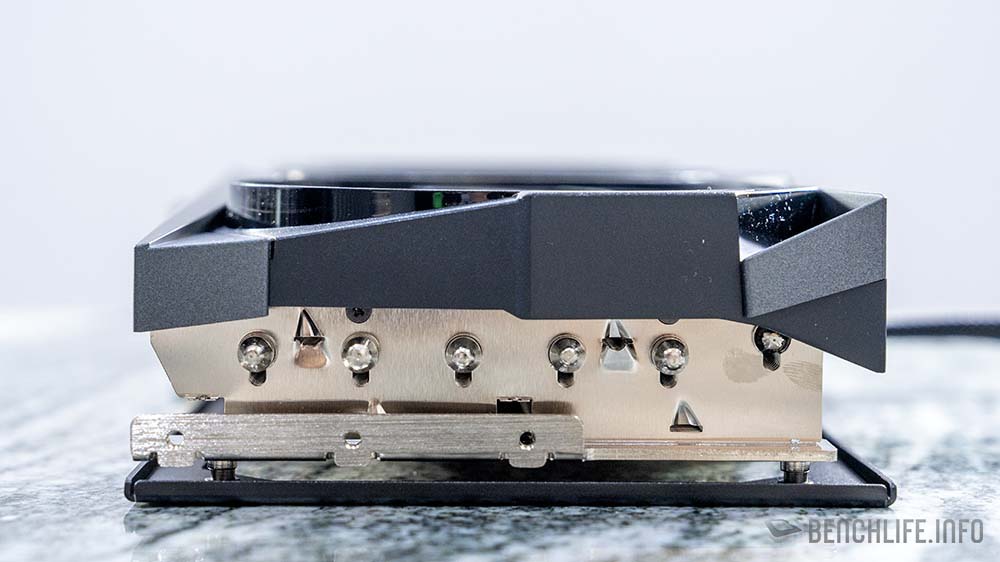
200W 的顯示卡不需出動 Vapor Chamber,所以 Gaming X Trio 採用鍍鎳桶底座,搭配上方形熱導管,想要為 GeForce RTX 4070 帶來最佳效能表現,至於溫度表現如何,後面我們會針對這部分提供實測數據讓大家參考。
當然,Tri Frozr 3 散熱設計也提供 0dBA 停轉功能。
我們收到的系列 GeForce RTX 4070 顯示卡測試中,MSI GeForce RTX 4070 Gaming X Trio 與 NVIDIA GeForce RTX 4070 Founders Edition 是唯二採用 12VHPWR 的顯示卡,因此顯示卡本身附上一組 2x 8 Pin to 12VHPWR 轉接線供使用;安裝轉接線的時候,記得留意是否有將接頭推至最裡面,再三確認避免憾事發生。
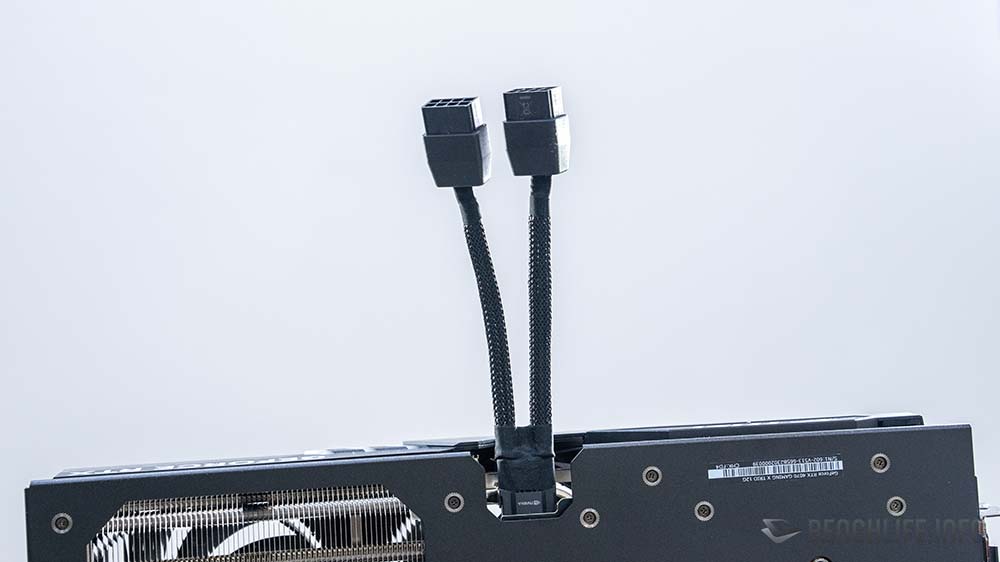
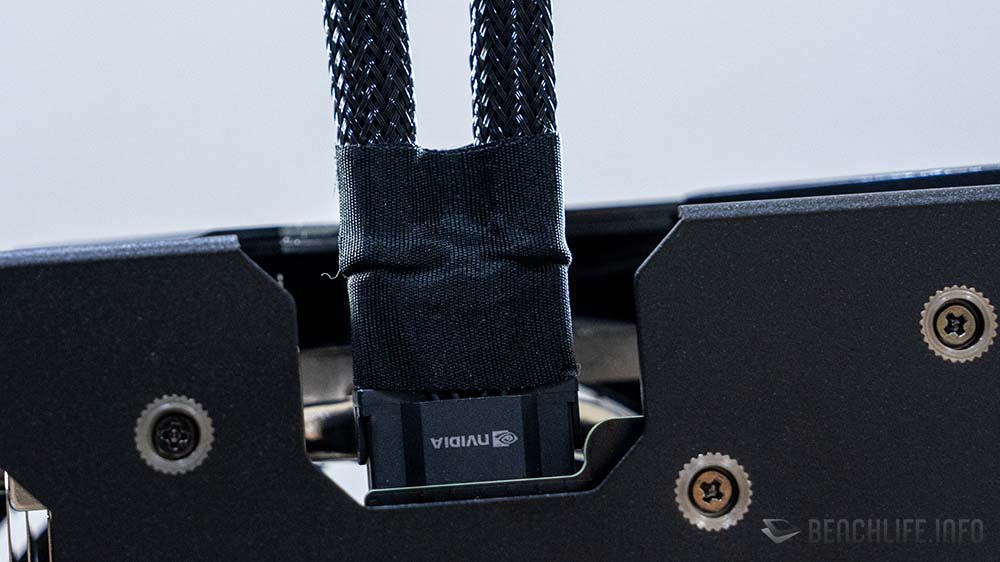
GeForce RTX 4070 Gaming X Trio 除了附有 2x 8 Pin to 12VHPWR 轉接線外,同時還提供 1 組顯示卡支撐架。
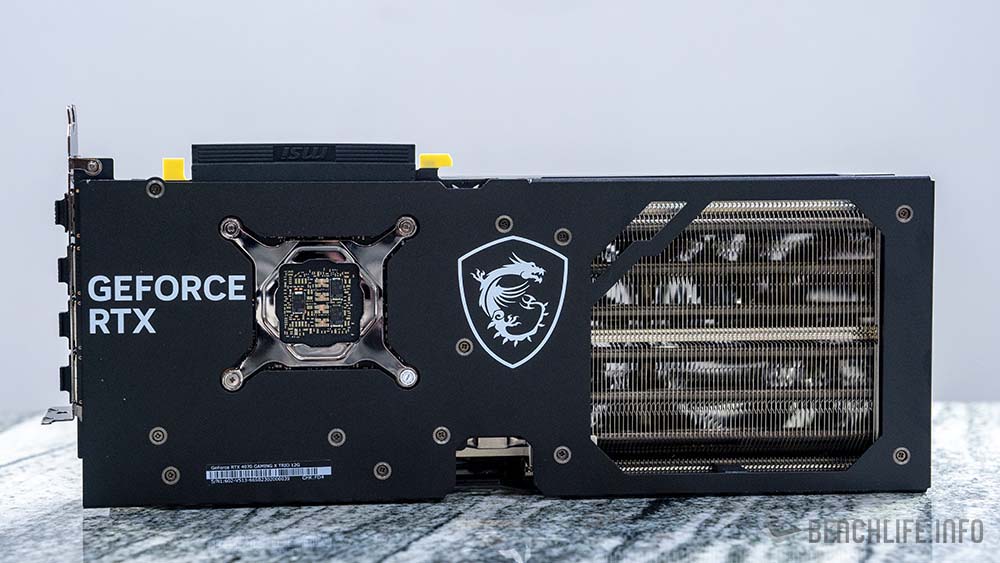
金屬強化背板也是 MSI GeForce RTX 4070 Gaming X Trio 的特色之一。不難見到,GeForce RTX 4070 Gaming X Trio 的 PCB 並不長… 大約只佔了散熱器的一半多一點,至於 Gaming X Trio 3 風扇的表現,接下去看就知道了。
MSI GeForce RTX 4070 Gaming X Trio 的 I/O 配置與 GeForce RTX 4070 Founders Edition 相同為 DP|DP|DP|HDMI。
與 GIGABYTE GeForce RTX 4070 WindForce OC 同為 3 風扇設計,但 MSI GeForce RTX 4070 Ti Gaming X Trio 整體要有份量許多,接下來就是看看這張採用 12VHPWR 接頭的 GeForce RTX 4070 顯示卡表現。
測試平台
CPU – Intel Core i9-13900K
Motherboard – MSI MEG Z790 GodLike
RAM – G.SKILL Trident Z5 DDR5 6000MT/s 16GB x2
3DMark – NVIDIA GeForce RTX 4070 Founders Edition
| 3DMark | GeForce RTX 4070 Founders Edition | MSI GeForce RTX 4070 Gaming X Trio | |
|---|---|---|---|
| TIme Spy | 18829 | 18735 | -0.502% |
| Graphic score | 18135 | 18080 | -0.304% |
| CPU score | 24047 | 23581 | -1.976% |
| Time Spy Extreme | 9055 | 9152 | 1.060% |
| Graphic score | 8556 | 8646 | 1.041% |
| CPU score | 13529 | 13696 | 1.219% |
| Fire Strike | 38350 | 36798 | -4.218% |
| Graphic score | 43760 | 44087 | 0.742% |
| Physics score | 55953 | 55921 | -0.057% |
| Combo score | 14729 | 13368 | -10.181% |
| Fire Strike Extreme | 21207 | 21356 | 0.698% |
| Graphic score | 21340 | 21518 | 0.827% |
| Physics score | 56245 | 55915 | -0.590% |
| Combo score | 10705 | 10767 | 0.576% |
| Fire Strike Ultra | 10413 | 10560 | 1.392% |
| Graphic score | 10001 | 10175 | 1.710% |
| Physics score | 56181 | 55991 | -0.339% |
| Combo score | 5445 | 5463 | 0.329% |
| Port Royal | 11255 | 11322 | 0.592% |
| Ray Tracing | 51.56 | 51.48 | -0.155% |
| Speed Way | 4484 | 4515 | 0.687% |
| DLSS Feature test | |||
| native | 23.16 | 23.28 | 0.515% |
| DLSS 3 | 85.18 | 85.44 | 0.304% |
1440p Gaming – NVIDIA GeForce RTX 4070 Founders Edition
| 1440p | GeForce RTX 4070 Founders Edition | MSI GeForce RTX 4070 Gaming X Trio | |
|---|---|---|---|
| Cyberpunk2077 | 80.35 | 81.44 | 1.338% |
| Cyberpunk2077(RT) | 38.98 | 39.73 | 1.888% |
| Cyberpunk2077(DLSS 3 / DLSS / RSR Quality) | 98.2 | 104.53 | 6.056% |
| F1 22(Ultra) | 75 | 75 | 0.000% |
| F1 22(DLSS 3 / DLSS / FSR) | 152 | 152 | 0.000% |
| Hitman 3 | 187.33 | 189.5 | 1.145% |
| Hitman 3(RT) | 53.74 | 54.88 | 2.077% |
| Hitman 3(DLSS 3 / DLSS / FSR) | 119.43 | 119.99 | 0.467% |
| Portal RTX | 22 | 26.7 | 17.603% |
| Portal RTX(DLSS 3 / DLSS ) | 72.9 | 83.9 | 13.111% |
| Horizon Zero Dawn | 141 | 142 | 0.704% |
| Shadow of the Tomb Raider | 163 | 164 | 0.610% |
| Tom Clancy's Rainbow Six Siege | 508 | 506 | -0.395% |
| Borderlands 3 | 105.76 | 106.69 | 0.872% |
| Total Wars Three Kingdom | 90.7 | 91.2 | 0.548% |
| Metro Exodus | 102.27 | 102.99 | 0.699% |
1080p Gaming – NVIDIA GeForce RTX 4070 Founders Edition
| 1080p | GeForce RTX 4070 Founders Edition | MSI GeForce RTX 4070 Gaming X Trio | |
|---|---|---|---|
| Cyberpunk2077 | 126.64 | 126.41 | -0.182% |
| Cyberpunk2077(RT) | 63.09 | 64.01 | 1.437% |
| Cyberpunk2077(DLSS 3 / DLSS / RSR Quality) | 165.91 | 167.91 | 1.191% |
| F1 22(Ultra) | 110 | 109 | -0.917% |
| F1 22(DLSS 3 / DLSS / FSR) | 207 | 208 | 0.481% |
| Hitman 3 | 280.23 | 281 | 0.274% |
| Hitman 3(RT) | 81.93 | 82.93 | 1.206% |
| Hitman 3(DLSS 3 / DLSS / FSR) | 171.35 | 171.74 | 0.227% |
| Portal RTX | 47 | 47.4 | 0.844% |
| Portal RTX(DLSS 3 / DLSS ) | 137.2 | 134.8 | -1.780% |
| Horizon Zero Dawn | 182 | 182 | 0.000% |
| Shadow of the Tomb Raider | 238 | 239 | 0.418% |
| Tom Clancy's Rainbow Six Siege | 704 | 687 | -2.475% |
| Borderlands 3 | 156.4 | 150.96 | -3.604% |
| Total Wars Three Kingdom | 143.3 | 143.7 | 0.278% |
| Metro Exodus | 127.89 | 128.49 | 0.467% |
Creator – NVIDIA GeForce RTX 4070 Founders Edition
| Creator | GeForce RTX 4070 Founders Edition | MSI GeForce RTX 4070 Gaming X Trio | |
|---|---|---|---|
| Blender | |||
| Monster | 3086 | 3101 | 0.484% |
| Junk Store | 1508 | 1513 | 0.330% |
| classroom | 1519 | 1518 | -0.066% |
| Vray | |||
| GPU | 2606 | 2618 | 0.458% |
| Pugetbench DaviniCi | |||
| Extended Overall | 2233 | 2250 | 0.756% |
| Standard Overall | 2440 | 2463 | 0.934% |
| 4K Media Score | 175 | 174 | -0.575% |
| 8K Media | 161 | 161 | 0.000% |
| GPU Effects Score | 129 | 128 | -0.781% |
| Fusion Score | 428 | 437 | 2.059% |
| Pugetbench Premiere Pro | |||
| Extended overall score | 1080 | 1089 | 0.826% |
| Standard overall score | 1192 | 1195 | 0.251% |
| Extended export score | 123.3 | 123.2 | -0.081% |
| Extended live playback | 87.8 | 90.1 | 2.553% |
| Standar Export Score | 137.3 | 137.9 | 0.435% |
| Standar Live Playback Score | 107.3 | 107.4 | 0.093% |
| Effects Score | 113 | 113.3 | 0.265% |
| GPU score | 102 | 103.1 | 1.067% |
| Stable Diffusion | |||
| 768x768 batch cout 10(it/s) | 4.07 | 4.13 | 1.453% |
| Omniverse Create Viewport(DLSS 3 / DLSS) | |||
| 2K / DLSS Quality | |||
| Campfire(FPS) | 38.81 | 42.55 | 8.790% |
| Flowers4(FPS) | 36.3 | 38.52 | 5.763% |
| incense (FPS) | 44.12 | 44.58 | 1.032% |
| Jade Tiger (FPS) | 30.7 | 31.64 | 2.971% |
| Warehouse(FPS) | 23.16 | 23.3 | 0.601% |
效能表現部分,非 MSRP 售價的 MSI GeForce RTX 4070 Gaming X Trio 整體要比 GeForce RTX 4070 Founders Edition 好。
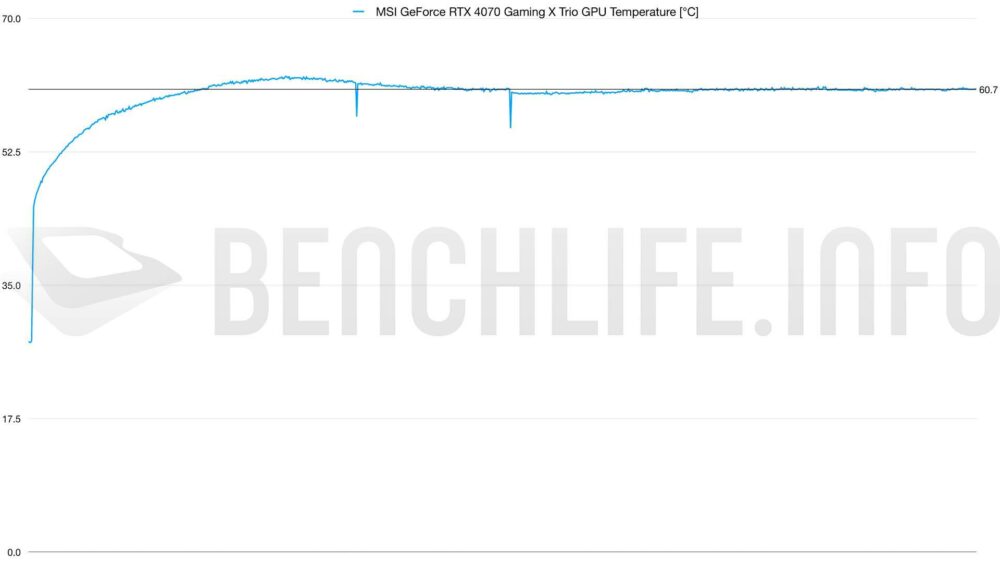
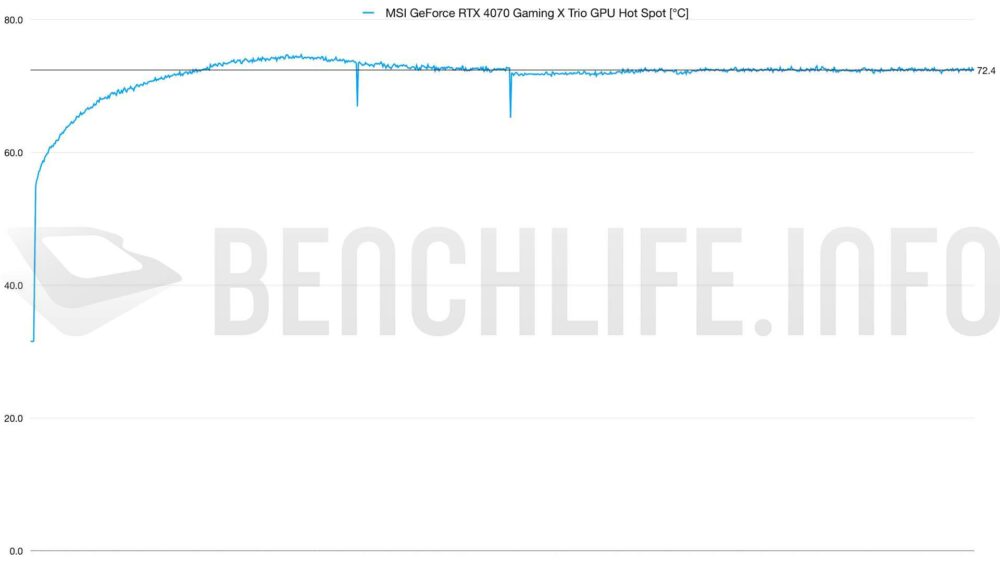
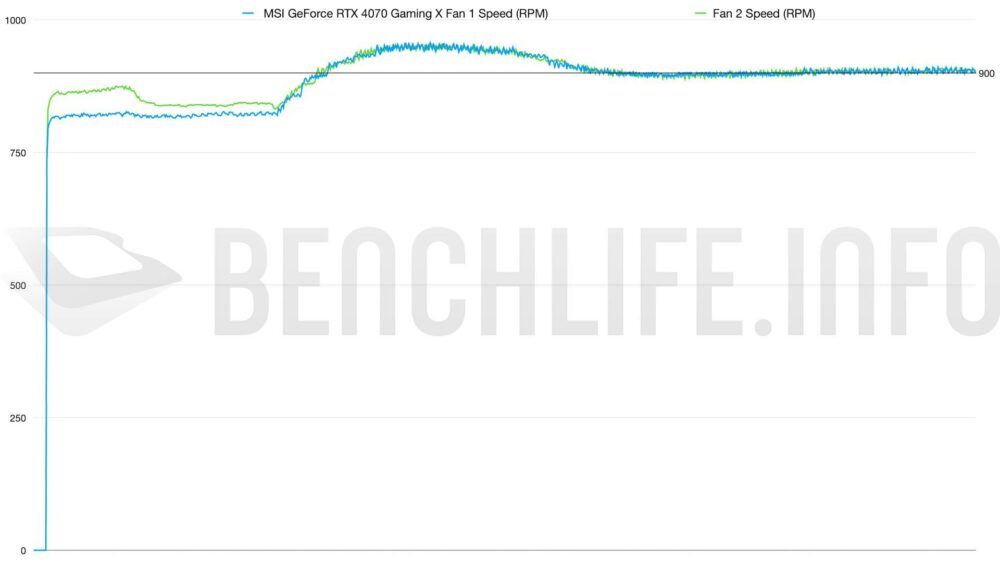
溫度表現是我們非常好奇的部分,從數據來看看 GeForce RTX 4070 Gaming X Trio 的溫度為 60.7°C、GPU Hot Spot 在 72.4°C,非常訝異的是原廠預設的風扇轉速中間值在 900 R.P.M,且最高並沒有突破 1000 R.P.M,是我們手上表現最佳的一款 GeForce RTX 4070。
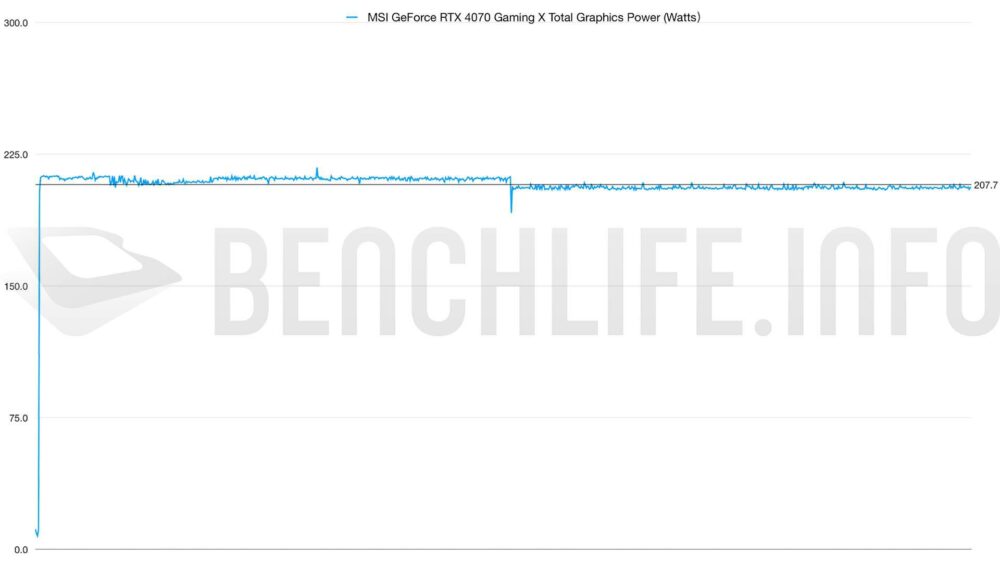
MSI GeForce RTX 4070 Gaming X Trio 的 TGP 在 Furmark 壓力測試下,可以來到 207.7W 這個數值。
與 2 槽設計的 NVIDIA GeForce RTX 4070 Founders Edition 相比較的話:
GPU TEMP – 64.4 vs 60.7,Δ 3.7°C;
GPU Hot Spot – 76.8 vs 72.4,Δ 4.4°C;
FANS – 1614 vs 900,Δ 714 R.P.M;
TGP – 191.2 vs 207.7,Δ 16.5W;
剛拿到 MSI GeForce RTX 4070 Gaming X Trio 顯示卡的瞬間,會有一種拿到 GeForce RTX 4080 的感覺,畢竟與 NVIDIA GeForce RTX 4070 Founders Edition 相比較的話,它真的過於「巨大」。不過,這樣的想法在測試完成後,見到溫度表現就有了不同的想法。
再加上不到 1,000 R.P.M 的風扇轉速表現,如果把風扇轉速往上調整的話,要降低到 60°C 以下應該不會有太大難度,不過我們並沒有針對這部分進行實測。
MSI GeForce RTX 4070 Gaming X Trio 採用 12VHPWR 接頭,所以我們見到 200W TGP 的突破;與 Founders Edition 的 16.5W 差異真的有點大,不過顯示卡並不是長時間維持在滿載。不過,正常來說,採用 PCIe 8 PIN 供電的 GeForce RTX 4070 顯示卡也有機會突破 200W。
總結來說,這張顯示卡的溫度、散熱表現讓我們相當滿意,但這部分使用的是體積來進行交換,對於小機箱的使用者可能是一個挑戰,至於一般 ATX 機殼的玩家可能就不會有那麼多問題。另外就是 60.7°C 的 GPU 溫度表現,確實讓我們驚艷,而且這是以不到 1,000 R.P.M 的風扇轉速達成。
針對 3 風扇的 MSI GeForce RTX 4070 Gaming X Trio 到這裡暫告一段落,謝謝收看。
NVIDIA GeForce RTX 4070 實測
- 1. NVIDIA GeForce RTX 4070 Founders Edition
2. ASUS Dual GeForce RTX 4070
3. GIGABYTE GeForce RTX 4070 WindForce OC
4. MSI GeForce RTX 4070 Gaming X Trio
5. ASUS TUF Gaming GeForce RTX 4070