主流級別的 Blackwell GPU 架構隨著 70 級別來到,而要開始陸續登場啦。
從 1 月份開始,我們陸續看了 GeForce RTX 5090 與 GeForce RTX 5080(雖然很多人都買不到),2 款採用 Blackwell GPU 架構的 GeForce RTX 50 系列顯示卡,而進入到 2 月份,GeForce RTX 5070 Ti 則是率先登場。
與 GeForce RTX 5090 和 GeForce RTX 5080 不同,GeForce RTX 5070 Ti 沒有提供 Founders Edition,而是讓各 AIC 合作夥伴自由發揮。
這次我們收到的是 MSI GeForce RTX 5070 Ti 16G Ventus 3X OC。
GeForce RTX 5070 Ti 與 GeForce RTX 5080 相同,採用 Blackwell GPU 架構中,代號 GB203 的晶片,但大家都知道,GeForce RTX 5070 Ti 的規格會比 GeForce RTX 5080 低了些許,雖然 2 者都擁有 256 bit、16GB GDDR7 記憶體配置。
Blackwell aka NVIDIA GeForce RTX 50 Series
| GeForce RTX 5070 | GeForce RTX 5070 Ti | GeForce RTX 5080 | GeForce RTX 5090 | |
| GPU Codename | GB205 | GB203 | GB203 | GB202 |
| Architecture | Blackwell | |||
| Transistor Count | 31.1B | 45.6B | 45.6B | 92.2B |
| Die Size | 263mm2 | 378mm2 | 378mm2 | 750mm2 |
| Process | TSMC 4nm 4N | |||
| PCIe Interface | Gen 5.0 | |||
| GPCs | 5 | 6 | 7 | 11 |
| TPCs | 24 | 35 | 42 | 85 |
| SMs | 48 | 70 | 84 | 170 |
| CUDA Cores|SM | 128 | 128 | 128 | 128 |
| CUDA Cores|GPU | 6144 | 8960 | 10752 | 21760 |
| Tensor Cores|SM(5th Gen) | 4 | |||
| Tensor Cores|GPU(5th Gen) | 192 | 280 | 336 | 680 |
| GPU Boost Clock | 2512 MHz | 2452 MHz | 2617 MHz | 2407 MHz |
| RT Cores(4th Gen) | 48 | 70 | 84 | 170 |
| GDDR7 | 12GB | 16GB | 16GB | 32GB |
| Memory Interface | 192 bit | 256 bit | 256 bit | 512 bit |
| Memory Clock | 28 Gbps | 28 Gbps | 30 Gbps | 28 Gbps |
| Memory Bandwidth | 672 GB/s | 896 GB/s | 960 GB/s | 1792 GB/s |
| ROPs | 80 | 96 | 112 | 176 |
| Pixel Fill-rate | 201 GT/s | 235.4 GT/s | 293.1 GT/s | 423.6 GT/s |
| Texture Units | 192 | 280 | 336 | 680 |
| Texel Fill-rate | 482.3 GT/s | 686.6 GT/s | 879.3 GT/s | 1636.8 GT/s |
| L1 Data Cache | 6144KB | 8960KB | 10752KB | 21760KB |
| L2 Cache | 49152KB | 49152KB | 65536KB | 98304KB |
| Register Fill Size | 12288KB | 17920KB | 21504KB | 43520KB |
| NVENC(9th Gen) | 1x | 2x | 2x | 3x |
| NVDEC(6th Gen) | 1x | 1x | 2x | 2x |
| TGP(Total Graphics Power) | 250W | 300W | 360W | 575W |
然而,GeForce RTX 5080 記憶體時脈為 30Gbps,而 GeForce RTX 5070 Ti 則是 28Gbps;GB203 晶片的 GeForce RTX 5070 Ti 擁有 6 GPCs、35 TPCs 以及 70 SMs,也就是 8960 CUDA Cores。
4th Gen RT Cores 與 5th Gen Tensor Cores 都是 GeForce RTX 50 系列的重點,特別是 Tensor Cores 部分加入 FP4 運算能力。
隨之而來的,就是 DLSS 4。
DLSS 全名是 Deep Learning Super Sampling,深度學習超級採樣,是 NVIDIA 從 GeForce RTX 20 系列開始導入的技術。
GeForce RTX 50 系列支援 DLSS 多畫格生成功能、DLSS 畫格生成功能、DLSS 光線重建、DLSS 超高解析度以及深度學習反鋸齒(DLAA)。
Blackwell GPU 架構的 GeForce RTX 50 系列重點:
1. 專為神經著色(Neural Shading)設計的全新 SM 功能;
2. 全新 MaxQ 功能,帶來更佳的電源效率;
3. 4th Gen RT Cores;
4. 5th Gen Tensor Cores;
5. NVIDIA DLSS 4;
6. RTX 神經著色器(Neural Shaders);
7. AI 管理處理器(AMP);
8. GDDR7 記憶體;
9. Mega Geometry Technology;
前面已經提到 GeForce RTX 5070 Ti 沒有 Founders Edition,因此 NVIDIA 安排了 MSI GeForce RTX 5070 Ti 16G Ventus 3X OC 讓我們進行測試;另外,MSI 也安排了 Vanguard 系列的 GeForce RTX 5070 T 16G。
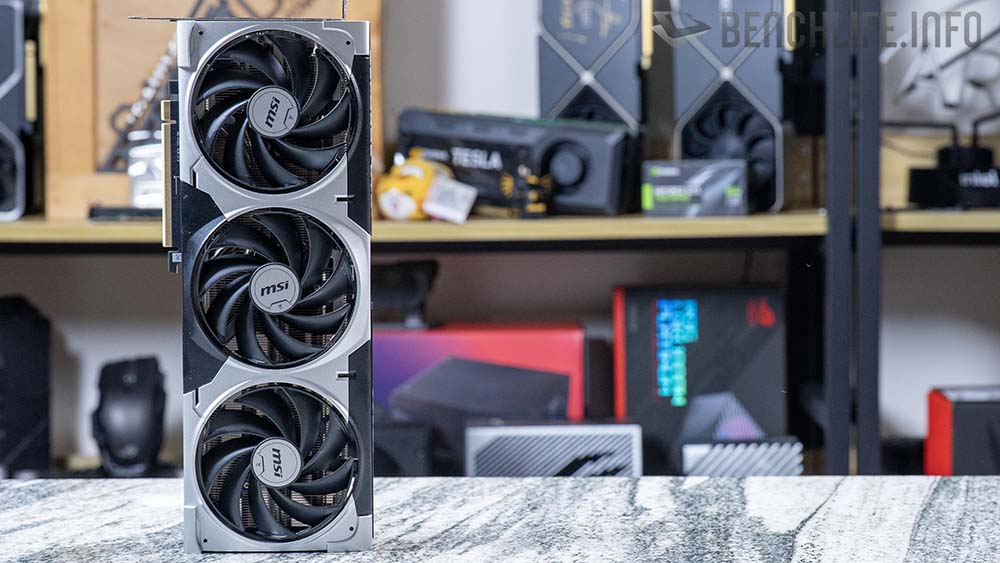
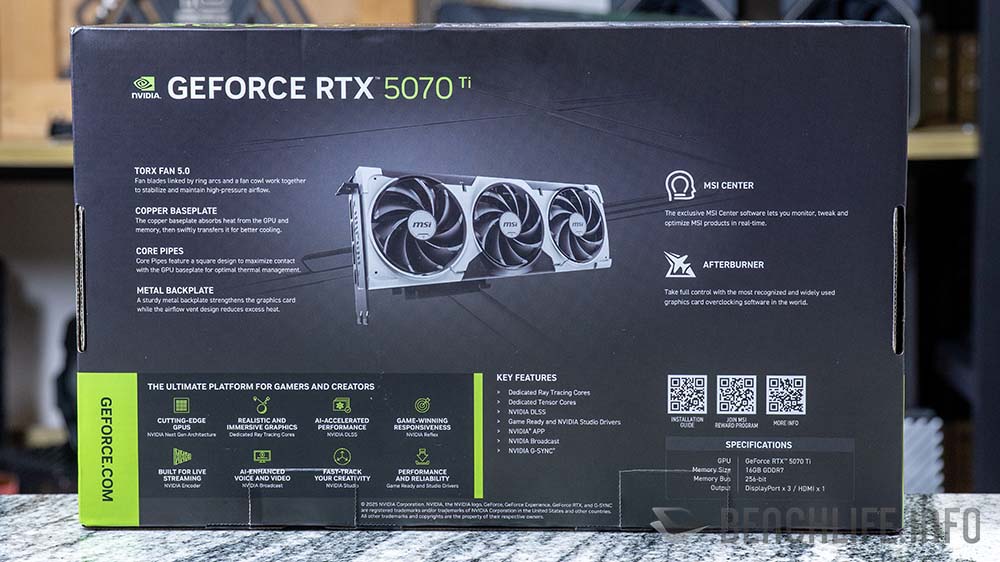
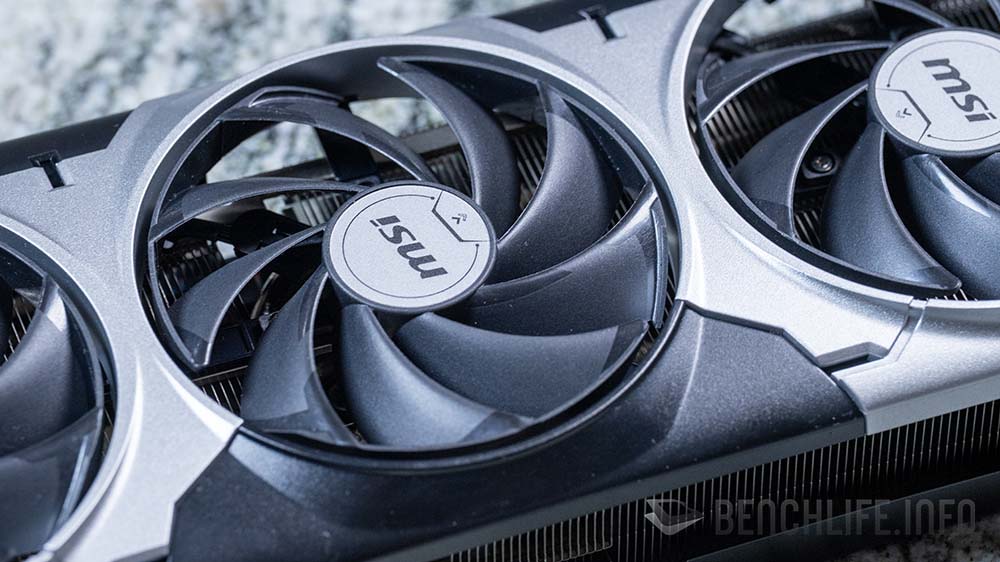
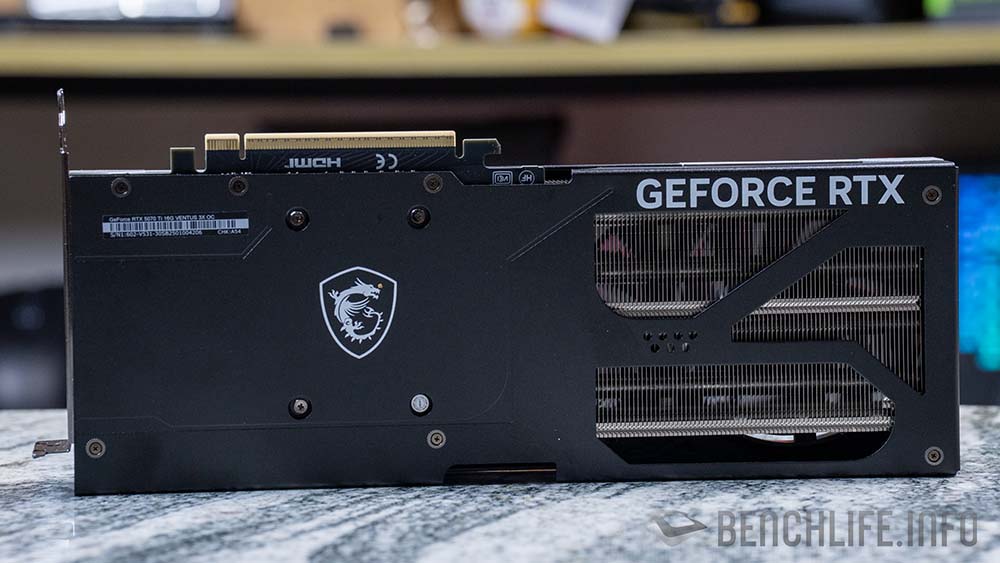
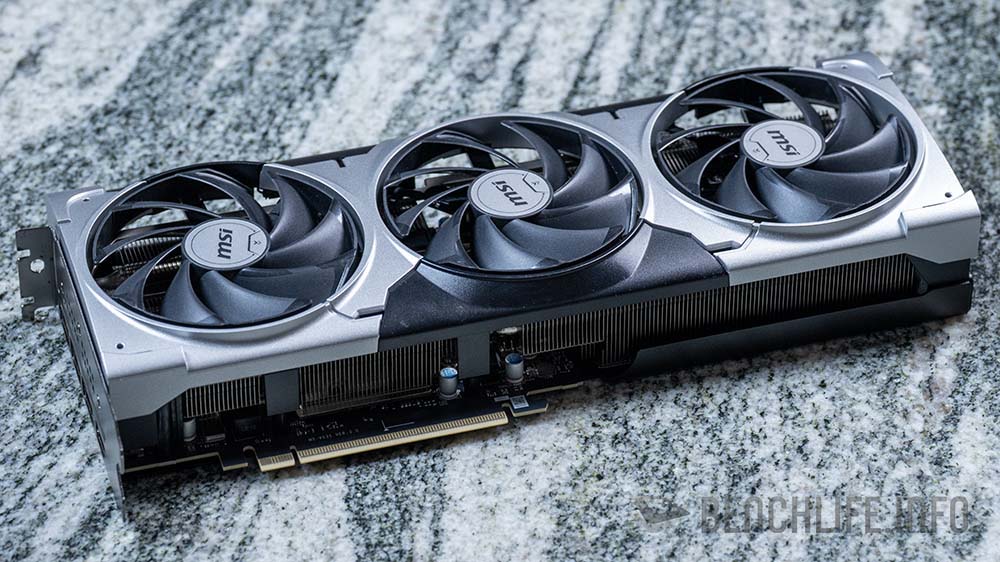
Ventus 3X 採用簡約的設計風格,與 Suprim 和 Vanguard 系列完全不同。在這樣簡約設計的前提下,我們不會在上面見到 RGB 燈光效果。
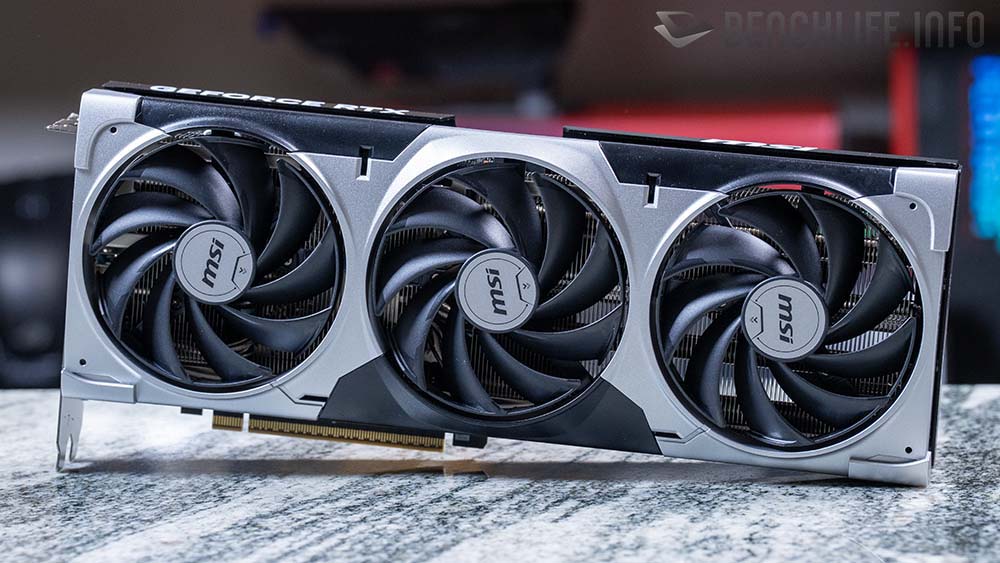
在 MSI GeForce RTX 50 的 Suprim 系列測試中我們就曾提到,MSI 將 TORX FAN 5.0 風扇下放至 Ventus 系列,而在 Suprim、Vanguard 與 Gaming Trio 系列則是採用新設計的 7 葉 StormForce 風扇。
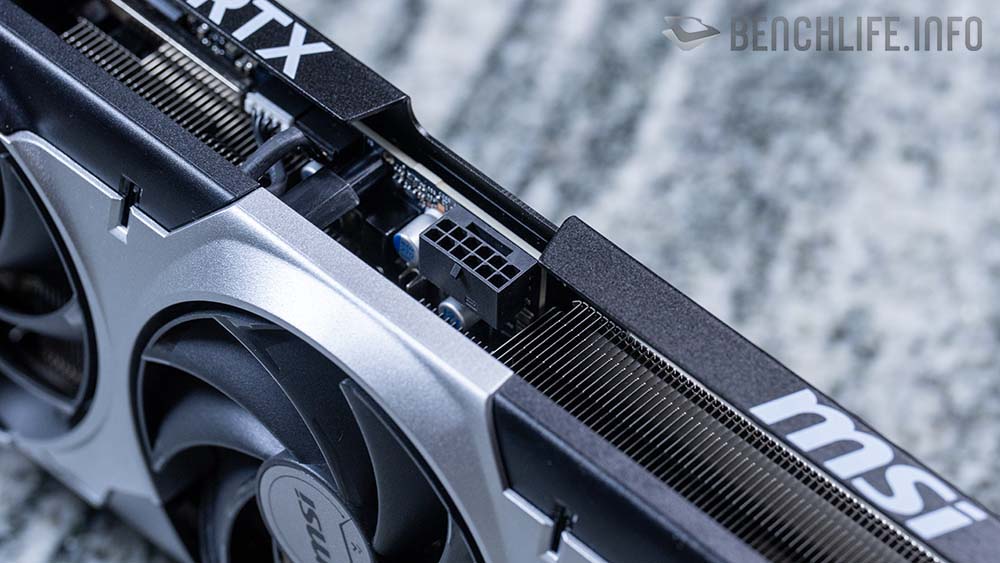
回到 Ventus 3X 這款 GeForce RTX 5070 Ti,整張卡的尺寸為 303 x 121 x 49mm,單卡重量為 1.073kg,TGP 為 300W(Total Graphic Power),使用單一 12V-2×6 接頭。
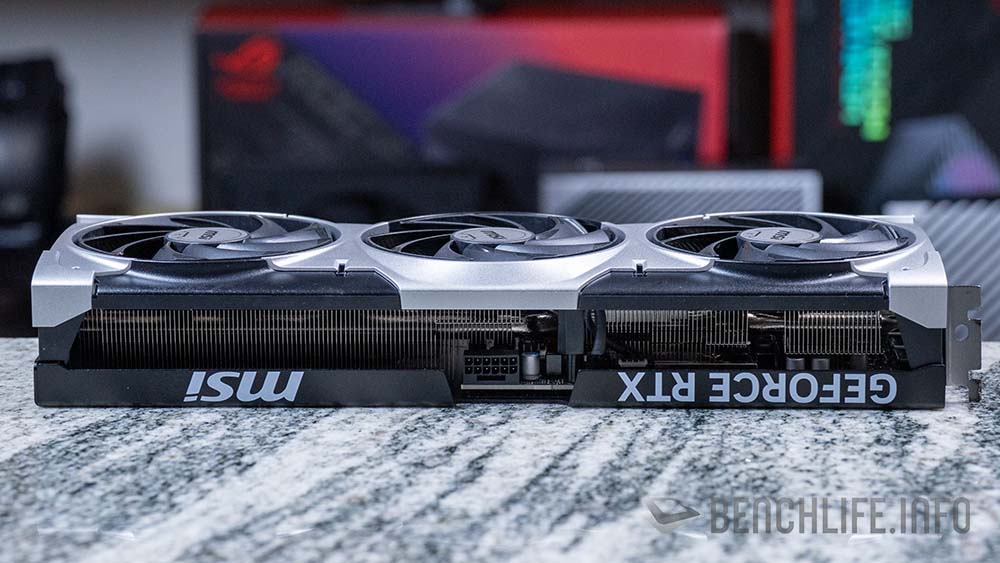
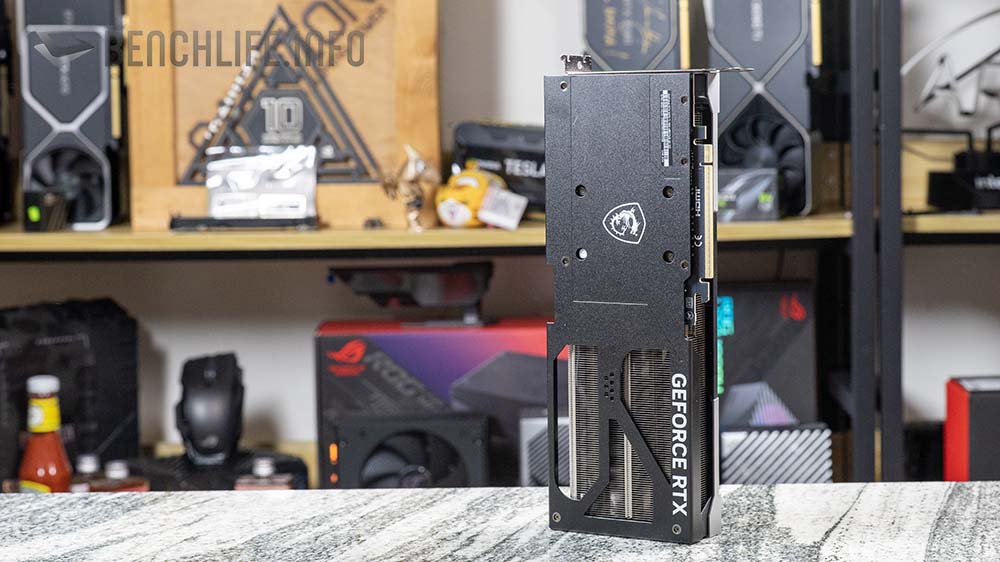
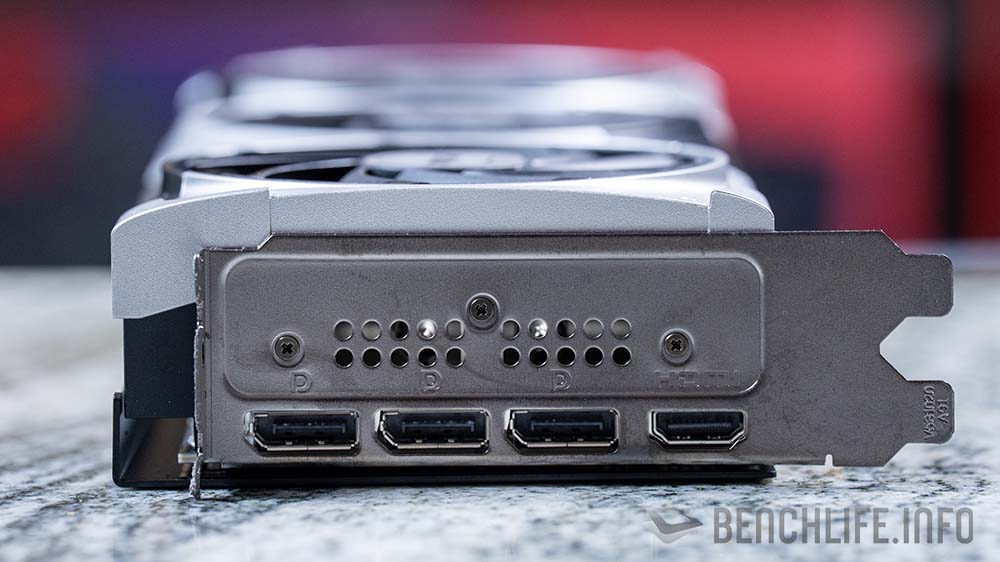
從設計來看,Ventus 3X 維持在 2.2 槽內,因此嚴格來說,可以視為一張 2 槽設計的顯示卡;I/O 配置為 3x DisplayPort 2.1b + 1x HDMI 2.1b。
另一方面,MSI 為 GeForce RTX 5070 Ti Ventus 3X 搭配金屬背板,提升了整張顯示卡的質感。
跟著來看看 Blackwell GPU 架構的 GeForce RTX 5070 Ti 與 GeForce RTX 4070 Ti Super 的效能測試;MSI GeForce RTX 5070 Ti 16G Ventus 3x 的 Boost Clock 為 2482MHz。
3DMark - MSI GeForce RTX 5070 Ti 16G Ventus 3X
| 3DMark | GeForce RTX 4070 Ti Super | GeForce RTX 5070 Ti | |
| TIme Spy | 22770 | 24454 | 6.886% |
| Graphic score | 24556 | 27581 | 10.968% |
| CPU score | 16127 | 14891 | -8.300% |
| TIme Spy Extreme | 10985 | 11741 | 6.439% |
| Graphic score | 12042 | 13509 | 10.859% |
| CPU score | 7339 | 6742 | -8.855% |
| Fire Strike | 45845 | 49584 | 7.541% |
| Graphic score | 56166 | 65221 | 13.884% |
| Physics score | 40057 | 38788 | -3.272% |
| Combo score | 21211 | 20831 | -1.824% |
| Fire Strike Extreme | 28022 | 32313 | 13.279% |
| Graphic score | 29285 | 34707 | 15.622% |
| Physics score | 40031 | 37528 | -6.670% |
| Combo score | 15802 | 18725 | 15.610% |
| Fire Strike Ultra | 15070 | 17952 | 16.054% |
| Graphic score | 14804 | 17807 | 16.864% |
| Physics score | 39661 | 38847 | -2.095% |
| Combo score | 8397 | 10286 | 18.365% |
| Steel Nomad | 5707 | 6421 | 11.120% |
| Steel Nomand Light | 26226 | 29270 | 10.400% |
| Portal Royal | 16067 | 18931 | 15.129% |
| Speed Way | 6529 | 7657 | 14.732% |
| DLSS Feature Test(FG OFF) | 34.71 | 41.87 | 17.101% |
| DLSS SR Performance | |||
| 2x | 131.08 | 151.07 | 13.232% |
| 4x | - | 252.55 | - |
單純看 Graphics 部分的分數,DirectX 12 的 Time Spy 系列差距在 10% 左右;DirectX 11 的 Fire Strike 系列差距則是介於 13 ~ 16%。
Port Royal 與 Speed Way 則是有 15% 的差距。
遊戲部分,我們依舊使用 3840 x 2160、2560 x 1440 與 1920 x 1080 等 3 種解析度進行測試。
4K Gaming - MSI GeForce RTX 5070 Ti Ventus 3x
| 4K Gaming | GeForce RTX 4070 Ti Super | GeForce RTX 5070 Ti | |
| Assassin's Creed Mirage | 91 | 94 | 3.191% |
| Alan Wake 2 | |||
| ULTRA_DLAA | 46 | 50 | 8.000% |
| RT_DLAA | - | 24 | - |
| Black Wukong | |||
| Cinematic | 32 | 36 | 11.111% |
| Cinematic_RT | - | 15 | - |
| Cinematic_RT_FG_Performance | 67 | 75 | 10.667% |
| Borderlands 3(ULTRA|DirectX 12) | 89.78 | 103.8 | 13.507% |
| CS2(VERY HIGH) | 142.9 | 174.9 | 18.296% |
| Cyberpunk 2077 | |||
| ULTRA | 45.33 | 57.87 | 21.669% |
| RT_ULTRA | 26.57 | 30.13 | 11.815% |
| PT | 13.85 | 15.92 | 13.003% |
| PT_Performance_FG | 78.8 | - | - |
| PT_Performance_FG_4X|DLSS 4 | - | 159.39 | - |
| F1 24 | |||
| ULTRA HIGH_UPSCALE OFF | 61 | 72 | 15.278% |
| UPSCALE QUALITY_FG | 120 | 150 | 20.000% |
| Final Fantasy 14 Dawntrail | 145.76 | 153.94 | 5.314% |
| Hitman 3 | 142.35 | 165.99 | 14.242% |
| Herizon Zero Dawn Remaster | 82 | 91 | 9.890% |
| Guardian of Galaxy(ULTRA|RT_ULTRA) | 67 | 78 | 14.103% |
| Metro Exodus(UTLRA) | 89.49 | 100.63 | 11.070% |
| Rainbow Six Siege(ULTRA|VULKAN) | 269 | 305 | 11.803% |
| Shadow of the Tomb Raide(HIGHEST) | 118 | 133 | 11.278% |
| StarWars Outlaw | |||
| ULTRA | 13 | 14 | 7.143% |
| DLSS_Performance_FG_2X|DLSS 3 | 74 | 89 | 16.854% |
| DLSS_Performance_FG_4X | - | 157 | - |
| Total War:War Hammer 3 | 61 | 75.3 | 18.991% |
4K 解析度遊戲的差距,大部分遊戲都在 10 ~ 11% 左右,其中 CS2 與 Total War:War Hammer 3 可以超過 18% ,甚至來到 20% 的差距。
然而 Final Fantasy 14 Dawntrail 的差距只有 5% 左右,是最不顯著的的一款遊戲。
1440P GAMING - MSI GeForce RTX 5070 Ti Ventus 3x
| 1440P Gaming | GeForce RTX 4070 Ti Super | GeForce RTX 5070 Ti | |
| Assassin's Creed Mirage | 144 | 145 | 0.690% |
| Alan Wake 2 | |||
| ULTRA_DLAA | 75 | 82 | 8.537% |
| RT_DLAA | - | 44 | - |
| Black Wukong | |||
| Cinematic | 52 | 57 | 8.772% |
| Cinematic_RT | - | 32 | - |
| Cinematic_RT_FG_Performance | 78 | 113 | 30.973% |
| Borderlands 3(ULTRA|DirectX 12) | 165.79 | 175.29 | 5.420% |
| CS2(VERY HIGH) | 278 | 315.1 | 11.774% |
| Cyberpunk 2077 | |||
| ULTRA | 107.11 | 128.15 | 16.418% |
| RT_ULTRA | 54.58 | 59.88 | 8.851% |
| PT | 30.78 | 34.04 | 9.577% |
| PT_Performance_FG | 145.49 | - | - |
| PT_Performance_FG_4X|DLSS 4 | - | 264.3 | - |
| F1 24 | |||
| ULTRA HIGH_UPSCALE OFF | 108 | 119 | 9.244% |
| UPSCALE QUALITY_FG | 194 | 242 | 19.835% |
| Final Fantasy 14 Dawntrail | 285.31 | 293.05 | 2.641% |
| Hitman 3 | 263.48 | 288.11 | 8.549% |
| Herizon Zero Dawn Remaster | 139 | 156 | 10.897% |
| Guardian of Galaxy(ULTRA|RT_ULTRA) | 130 | 151 | 13.907% |
| Metro Exodus(UTLRA) | 136.82 | 149.23 | 8.316% |
| Rainbow Six Siege(ULTRA|VULKAN) | 461 | 502 | 8.167% |
| Shadow of the Tomb Raide(HIGHEST) | 222 | 249 | 10.843% |
| StarWars Outlaw | |||
| ULTRA | 28 | 31 | 9.677% |
| DLSS_Performance_FG_2X|DLSS 3 | 137 | 148 | 7.432% |
| DLSS_Performance_FG_4X | - | 256 | - |
| Total War:War Hammer 3 | 115 | 145.2 | 20.799% |
同樣的問題也在 1440p 解析度中出現,Assassin’s Creed Mirage 的差異只有 0.69%,基本上可以視為相同表現。
1080P Gaming - MSI GeForce RTX 5070 Ti Ventus 3x
| 1080P Gaming | GeForce RTX 4070 Ti Super | GeForce RTX 5070 Ti | |
| Assassin's Creed Mirage | 180 | 178 | -1.124% |
| Alan Wake 2 | |||
| ULTRA_DLAA | 111 | 120 | 7.500% |
| RT_DLAA | - | 68 | - |
| Black Wukong | |||
| Cinematic | 66 | 77 | 14.286% |
| Cinematic_RT | - | 49 | - |
| Cinematic_RT_FG_Performance | 79 | 137 | 42.336% |
| Borderlands 3(ULTRA|DirectX 12) | 228.7 | 239.05 | 4.330% |
| CS2(VERY HIGH) | 392 | 429.2 | 8.667% |
| Cyberpunk 2077 | |||
| ULTRA | 173.94 | 196.52 | 11.490% |
| RT_ULTRA | 87.66 | 94.96 | 7.687% |
| PT | 52.11 | 56.61 | 7.949% |
| PT_Performance_FG | 204.2 | - | - |
| PT_Performance_FG_4X|DLSS 4 | - | 375.2 | - |
| F1 24 | |||
| ULTRA HIGH_UPSCALE OFF | 150 | 157 | 4.459% |
| UPSCALE QUALITY_FG | 246 | 315 | 21.905% |
| Final Fantasy 14 Dawntrail | 390.53 | 392.82 | 0.583% |
| Hitman 3 | 387.39 | 416.75 | 7.045% |
| Herizon Zero Dawn Remaster | 173 | 199 | 13.065% |
| Guardian of Galaxy(ULTRA|RT_ULTRA) | 190 | 222 | 14.414% |
| Metro Exodus(UTLRA) | 169.03 | 181.83 | 7.040% |
| Rainbow Six Siege(ULTRA|VULKAN) | 593 | 626 | 5.272% |
| Shadow of the Tomb Raide(HIGHEST) | 315 | 343 | 8.163% |
| StarWars Outlaw | |||
| ULTRA | 47 | 48 | 2.083% |
| DLSS_Performance_FG_2X|DLSS 3 | 151 | 165 | 8.485% |
| DLSS_Performance_FG_4X | - | 296 | - |
| Total War:War Hammer 3 | 164.7 | 211 | 21.943% |
GeForce RTX 5070 Ti 在 1080p 遊戲下,與 GeForce RTX 4070 Ti Super 的差距更小
Creator and AI - MSI GeForce RTX 5070 Ti Ventus 3x
| GeForce RTX 4070 Ti Super | GeForce RTX 5070 Ti | ||
| Blender | |||
| Monster | 3583 | 3635 | 1.431% |
| Junk Store | 1764 | 1961 | 10.046% |
| Fishy_Cat | 1852 | 1931 | 4.091% |
| VRAY | |||
| GPU | 6669 | 7922 | 15.817% |
| Geekbench 6 | |||
| OpenCL | 232023 | 237312 | 2.229% |
| Vulkan | 230838 | 238476 | 3.203% |
| Geekbench AI | |||
| Single Precision | 31840 | 33255 | 4.255% |
| Half Precision | 47035 | 56882 | 17.311% |
| Quantized | 23789 | 24574 | 3.194% |
| Procyon AI image generation | |||
| SD 1.5|INT8 | N/A | N/A | - |
| SD 1.5|FP16 | 2576 | 2815 | 8.490% |
| SDXL|FP16 | 2251 | 2434 | 7.518% |
| Procyon AI text generation | |||
| Phi-3.5-mini-instruct(Tokens/s) | 186.16 | 192.29 | 3.188% |
| Mistral 7B(Tokens/s) | 135.75 | 160.37 | 15.352% |
| Llama3-8B(Tokens/s) | 111.83 | 132.64 | 15.689% |
| LLama2-13B(Tokens/s) | 67.5 | 75.94 | 11.114% |
GeForce RTX 5070 Ti 與 GeForce RTX 4070 Ti Super 在 Procyon AI Text Generation 中的大型語言模型(LLMs)的測試比較,Blackwell GPU 架構的 GeForce RTX 5070 Ti 在 Mistral-7B 與 Llama3-8B 的表現較為明顯,有著 15% 的差距。
Phi-3.5-mini-instruct 的表現可以視為在誤差範圍內。
關於 Procyon AI Text Generation,可以參考我們早前的測試文章:更清楚知道顯示卡在 LLMs 的表現,UL Procyon 加入 AI Text Generation 測試項目
300W TGP 的 MSI GeForce RTX 5070 Ti Ventus 3X 顯示卡的溫度表現也是我們關注的部分,來看看在 Furmark 下,這款散熱器的實際表現。
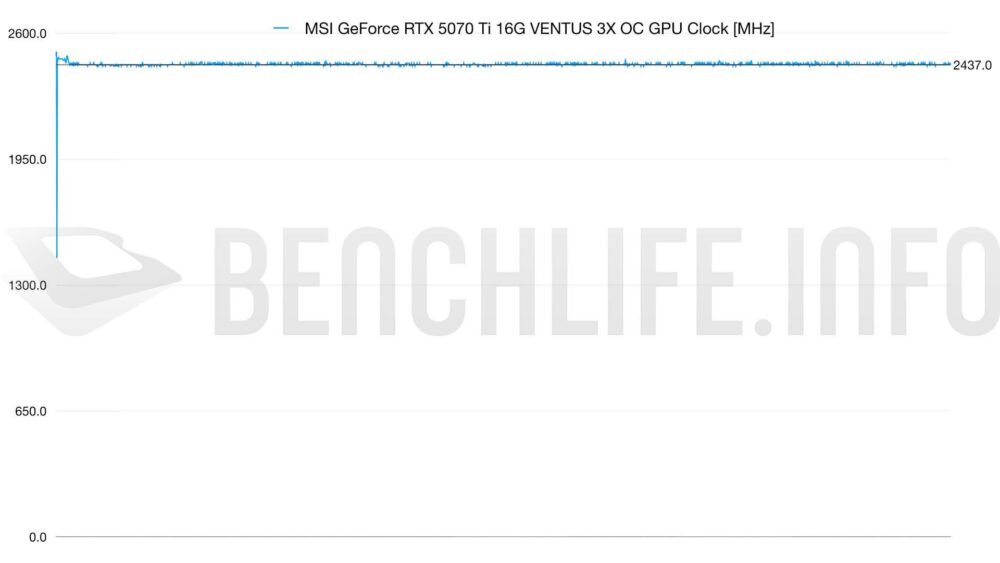
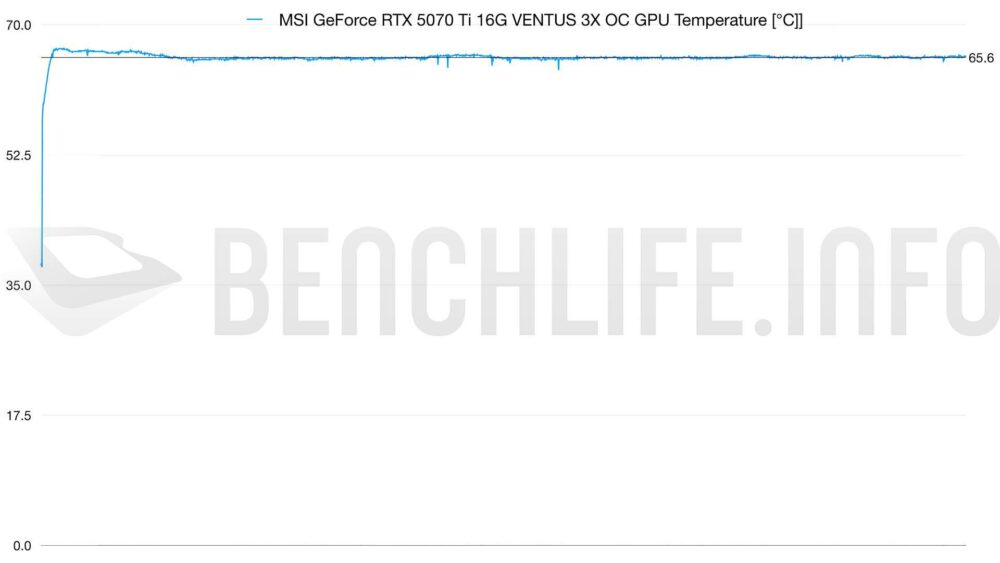
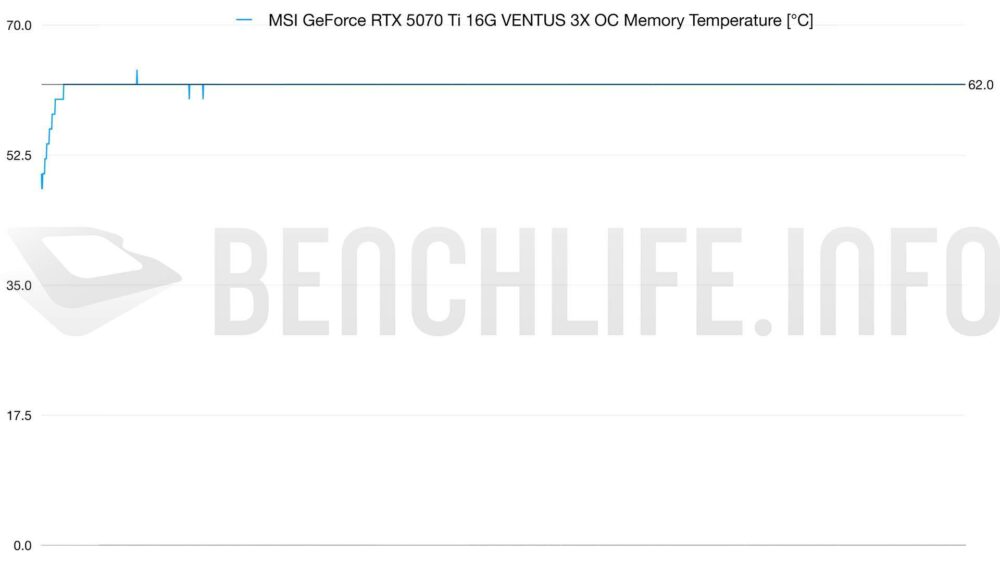
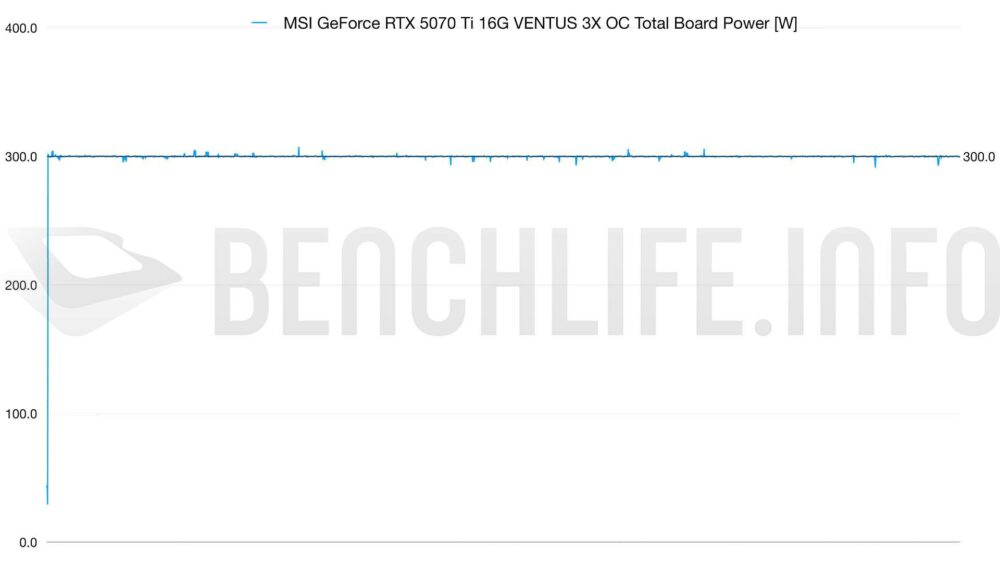
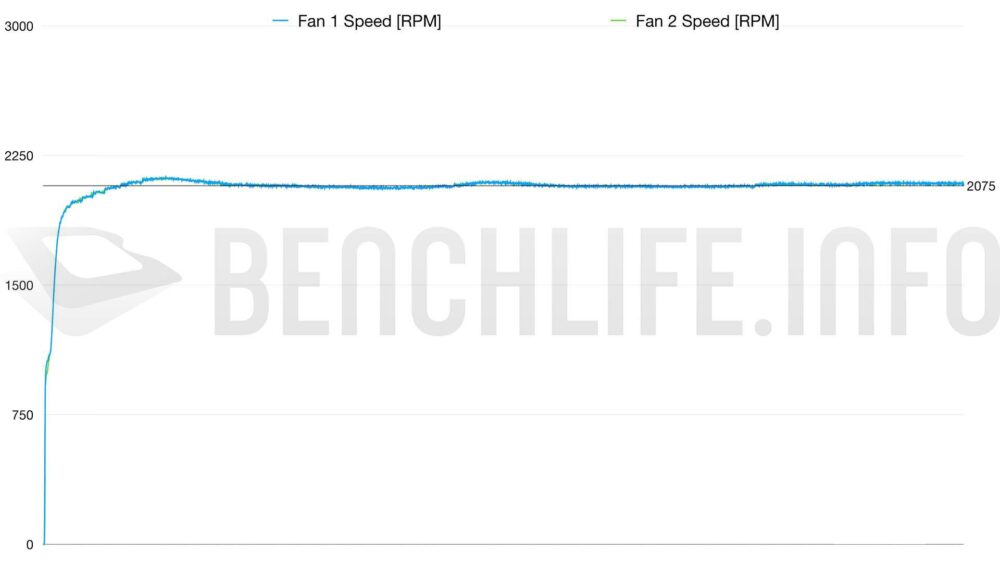
採用 TORX FAN 5.0 葉片的 Ventus 3X 散熱器,在 300W 的條件下,溫度表現如下:
TGP:300W:
GPU Clock:2437MHz;
GPU Temp:65.6 ℃;
GDDR7 Temp:62 ℃;
Fan Speed:2075 RPM;
對於大部分 4K 解析度遊戲來說,與 GeForce RTX 4070 Ti Super 相比的話,可以發現到,GeForce RTX 5070 Ti 有著相當不錯的表現,也可以知道 70 級別的 GeForce RTX 顯示卡也開始滿足 4K 遊戲玩家的需求。Blackwell GPU 架構的 GeForce RTX 5070 Ti 更換為 GDDR7 記憶體,Total Graphics Power 提升至 300W,較 GDDR6x 的 GeForce RTX 4070 Ti Super 的整卡功耗多了 15W。
透過測試數據,可以發現到 GeForce RTX 5070 Ti 與 GeForce RTX 4070 Ti 的表現差距,對比早前 GeForce RTX 5080 和 GeForce RTX 4080 Super 的差距,其增幅相當相似,只能說… 老黃刀法真的有嚴格在執行中。
因為時間關係,我們這次沒有加入 GeForce RTX 3070 Ti 的測試,畢竟它只有 8GB GDDR6x 記憶體配置。同樣的,透過早前在 GeForce RTX 5080 與 GeForce RTX 3080 Ti 比較數據來判斷,Blackwell GPU 架構與 Ampere GPU 架構的效能差距要更顯著許多。
隔代升級感受要更為顯著,GeForce RTX 5070 Ti 16GB 同樣給了我們這種感受,畢竟 GeForce RTX 3070 Ti 或 GeForce RTX 3070 的記憶體配置只有 8GB。
作為 Blackwell GPU 架構中,中高階的主流產品,NVIDIA GeForce RTX 5070 Ti 16GB GDDR7 開賣時間是 2 月 20 日晚上 10 點,也許 GeForce RTX 5070 Ti 要比 GeForce RTX 5080 與 GeForce RTX 5090 更好入手,但有時候就… 總之,早買早享受 ~ 且,749 美元的建議售價,要比 GeForce RTX 4070 Ti 推出時的 799 美元建議售價便宜些許。
以上是針對 MSI GeForce RTX 5070 Ti 16G Ventus 3X 的測試與介紹,謝謝收看。