Ada Lovelace 架構的老二,NVIDIA GeForce RTX 4080 正式解禁。
10 月份迎接了老大 GeForce RTX 4090 之後,GPU 晶片代號 AD103 的 GeForce RTX 4080 會在 11 月 16 日開賣,但與 GeForce RTX 4090 作法相同,NVIDIA 自己的 Founders Edition 能在 11 月 15 日解禁,至於 AIC 合作夥伴的 GeForce RTX 4080 的相關測試則需要在 11 月 16 日開賣同時才能解禁。
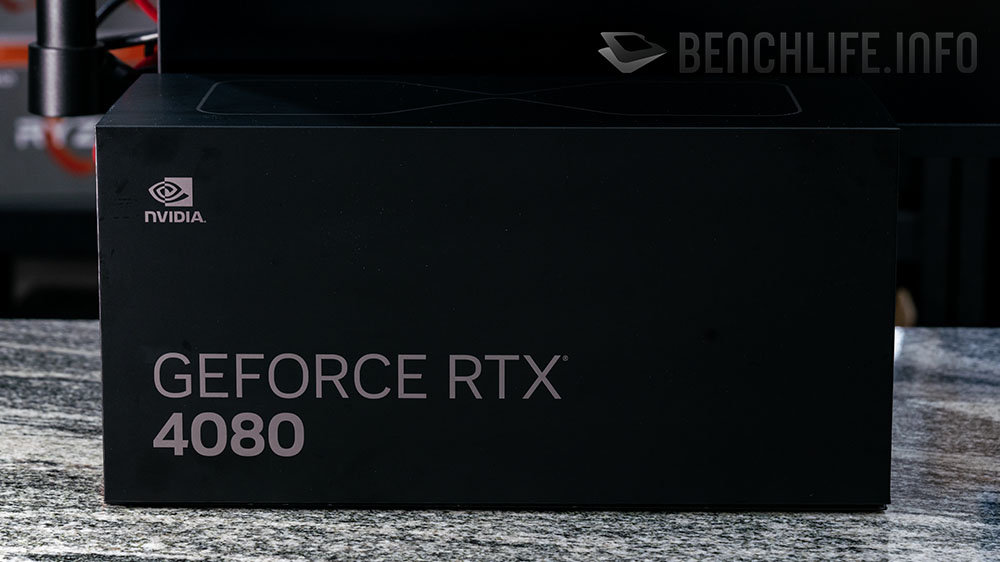
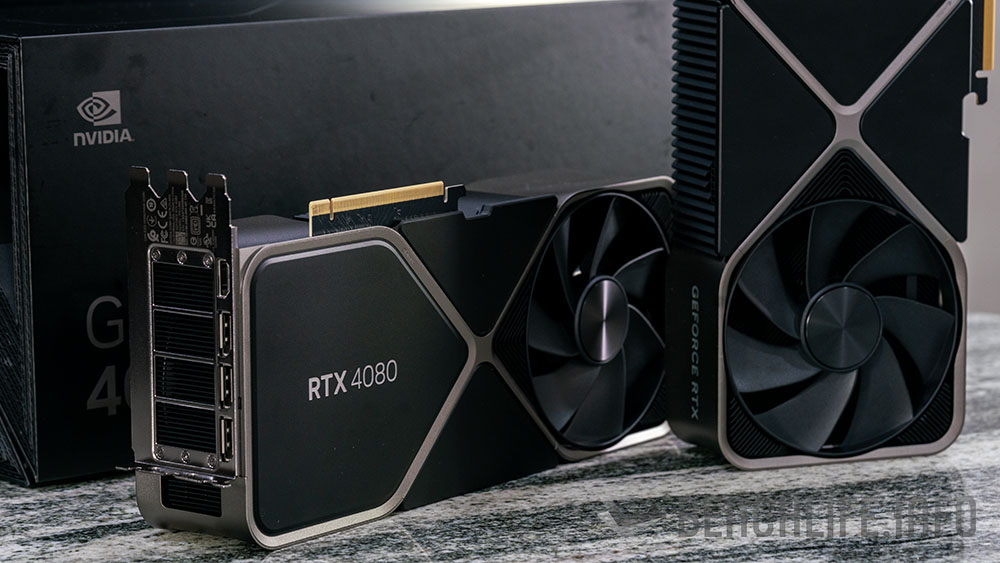
與 GeForce RTX 4090 時一樣,這次我們也收到 NVIDIA 寄來的 GeForce RTX 4080 Founders Edition 進行測試。
外觀設計上,GeForce RTX 4080 Founders Edition 基本上與 GeForce RTX 4090 Founders Edition 沒有太大差異。
雖然我們沒有拆卸 GeForce RTX 4080 Founders Edition 的散熱器,但與拆卸的媒體友人確認,預設 320W TDP 的 GeForce RTX 4080 Founders Edition 散熱器也用上了 Vapor Chamber,但 Vapor Chamber 的尺寸有較 GeForce RTX 4090 Founders Edition 小一些。
GeForce RTX 4090 Founders Edition 的 Vapor Chamber 與 GPU 接觸面有特別使用黑鎳處理,然而 GeForce RTX 4080 Founders Edition 這邊則是一般電鍍處理。
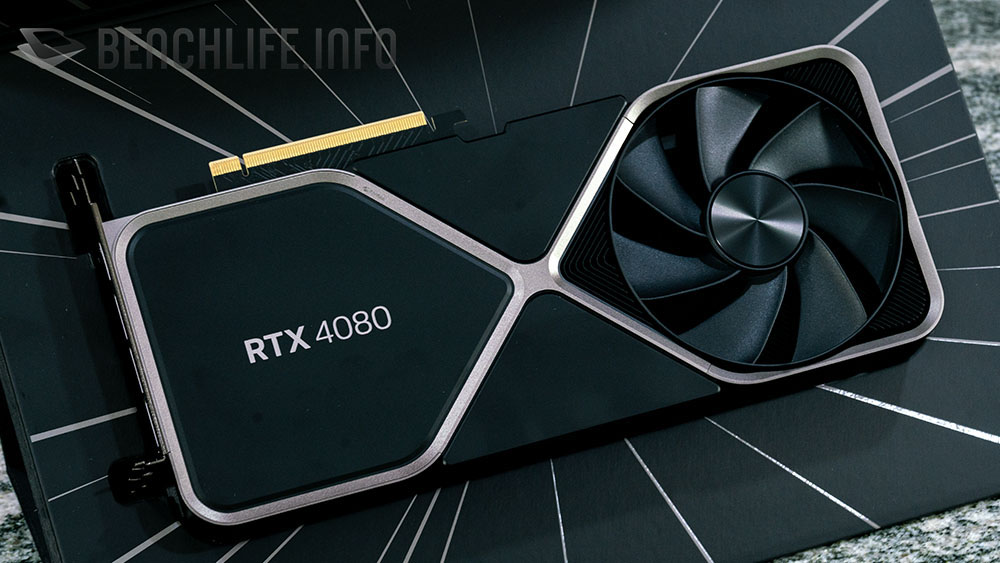
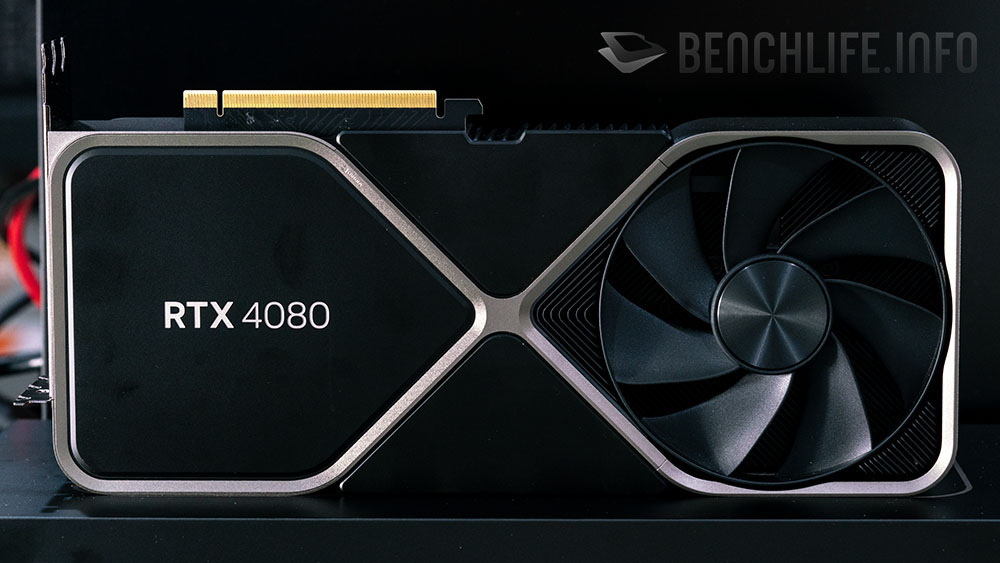
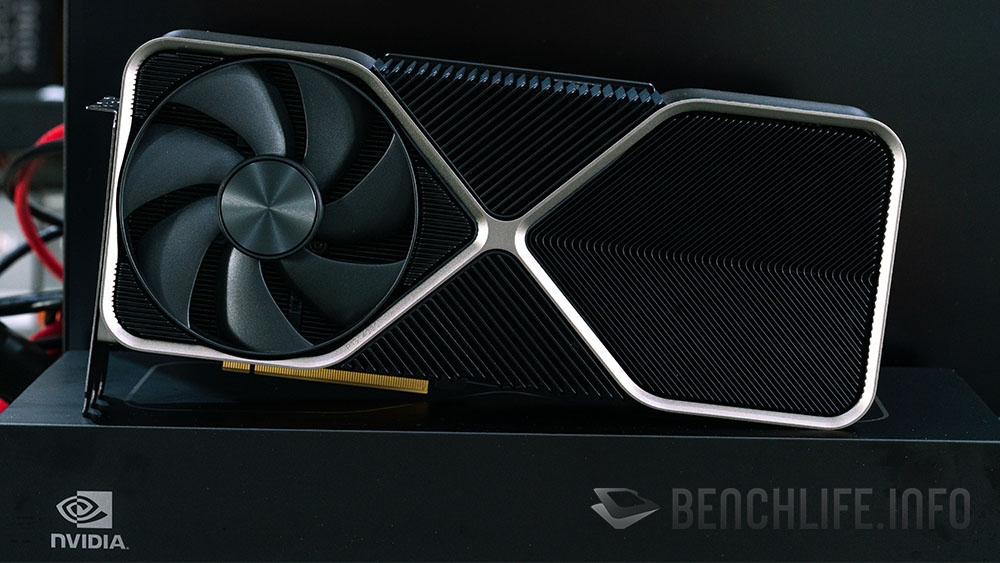
也就是說,GeForce RTX 4080 Founders Edition 維持 7 葉的雙 116mm 風扇設計,散熱器也提升至 3 slots 設計,長度提升至 30.48cm。
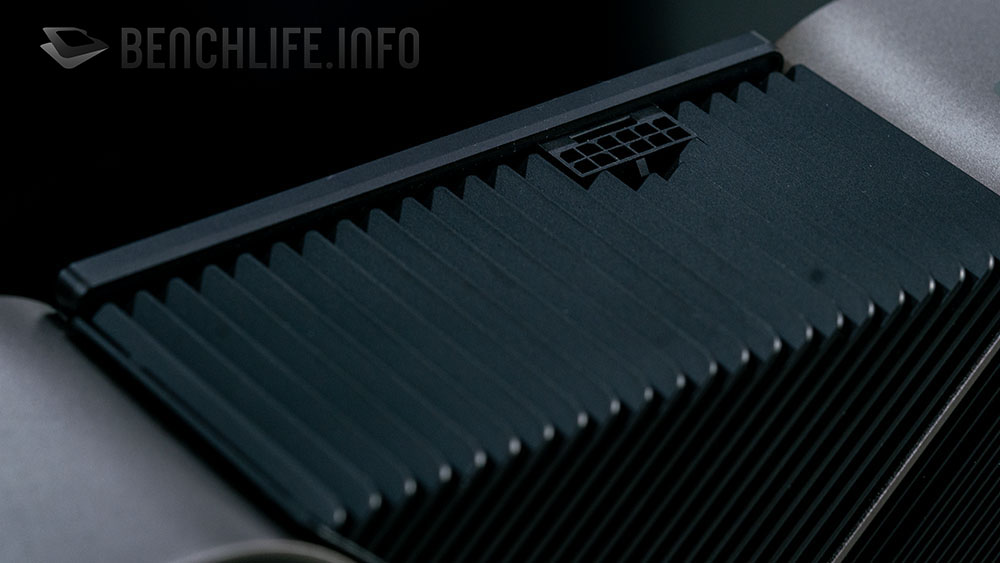
12VHPWR 接頭依舊存在著,這也是 NVIDIA 從 GeForce RTX 3090 Ti 開始的一個大轉變。
使用者可以透過顯示卡附贈的 12VHPWR 轉接線,或是 Intel ATX 3.0 規格的電源供應器 12VHPWR 直出線搭配使用;當然,也有些非 Intel ATX 3.0 規格電源供應器也附有 2x 8 PIN 或 3x 8 PIN 轉 12VHPWR 線材,那些都是可以使用的線材,無須擔心太多。
至於 GeForce RTX 4080 Founders Edition 附贈的是 3x 8 PIN to 12VHPWR 轉接線,主要原因是顯示卡的預設 TGP 只有 320W。
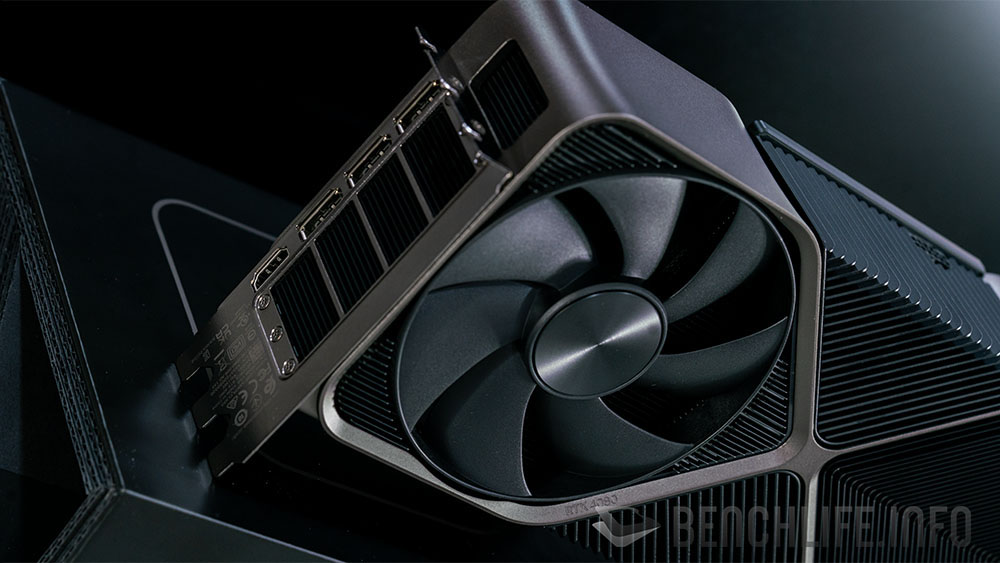
NVIDIA GeForce RTX 4080 訊號輸出端子依舊維持 HDMI 2.1 與 DisplayPort 1.4a,現在即使更改,也來不及就是了。
顯示卡外觀大致介紹完,接下來我們來看看 GeForce RTX 4080 16GB 的硬體規格。
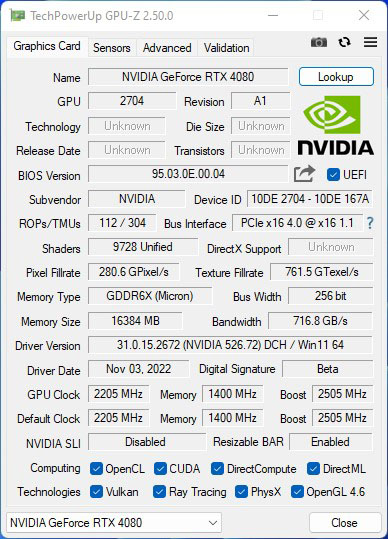
NVIDIA GeForce RTX 4080 擁有 16GB GDDR6x 記憶體配置,搭配的是代號 AD103 的 Ada Lovelace 架構 GPU。
| GeForce RTX 3080 Ti | GeForce RTX 4080 | |
|---|---|---|
| Graphics Processing Clusters | 7 | 7 |
| Texture Processing Clusters | 40 | 38 |
| Streaming Microprocessors | 80 | 76 |
| CUDA Cores | 10240 | 9728 |
| Tensor Cores | 320(3rd Gen) | 304(4th Gen) |
| RT Cores | 80(2nd Gen) | 76(3rd Gen) |
| Texture Units | 320 | 304 |
| ROPs | 112 | 112 |
| Boost Clock | 1665MHz | 2505MHz |
| Memory Clock | 9500MHz | 11200MHz |
| Memory Data Rate | 19Gbps | 22.4Gbps |
| L2 Cache Size | 6144KB | 6536KB |
| Memory | 12GB GDDR6x | 16GB GDDR6x |
Ada Lovelace 架構採用 TSMC N4 製程,其中 AD103 擁有 7 個 Graphics Processing Clusters,提供多達 9728 CUDA Cores(較 GeForce RTX 3080 Ti 的 10240 少),並且擁有 3rd Gen RT Cores 與 4th Gen Tensor Cores 都是較 Ampere 架構的 GeForce RTX 3080 Ti 具有優勢的部分。
此外,GeForce RTX 4080 的 GPU Boost Clock、Memory Clock 與 Memory Data Rate 都要較 GeForce RTX 3080 Ti 高出許多。
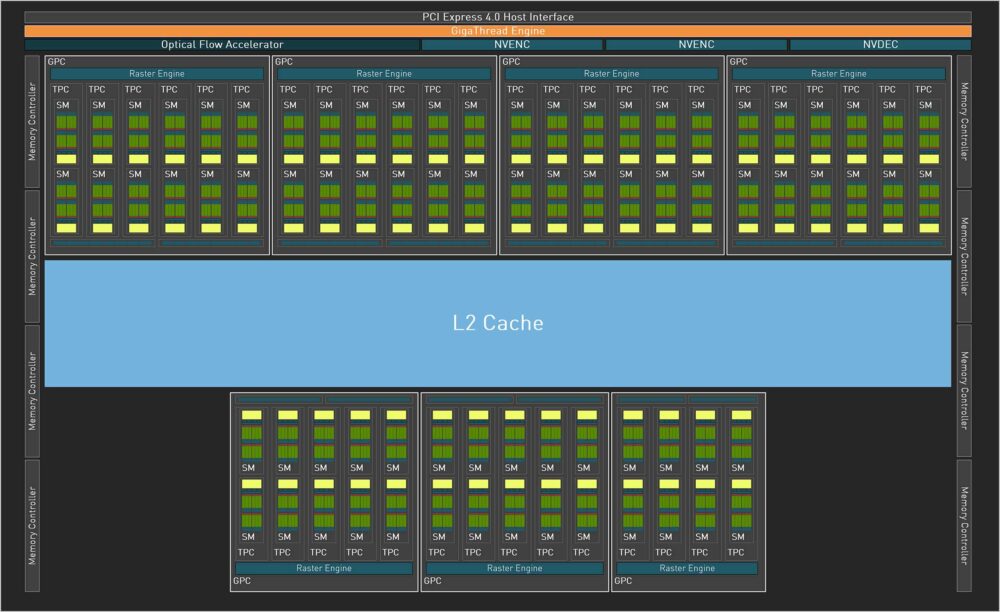
也因為 3rd Gen RT Cores 與 4th Gen Tensor Cores,讓 Ada Lovelace 架構的 GeForce RTX 40 系列擁有 DLSS 3 技術;DLSS 3 涵蓋 DLSS 2,但就如前所述,只有 Ada Lovelace 架構的 GeForce RTX 40 系列能完整支援 DLSS 3 技術。
Ada Lovelace 架構的 GeForce RTX 40 系列有好幾個重點:
1. 全新的 Streaming Multiprocessors(SM)
2. 4th Gen Tensor Cores 與 Optical Flow
3. 3rd Gen RT Cores
4. Shader Execution Reordering(SER)
5. DLSS 3
6. NVIDIA Studio
7. AV1 Encoders
跟著我們就來看看 GeForce RTX 4080 Founders Edition 與 GeForce RTX 3080 Ti Founders Edition 的測試比較。
測試平台處理器部分,我們使用 Intel Core i7-13700K 搭配 DDR5-6000MHz 記憶體進行本次測試,而顯示卡部分都是由 NVIDIA 提供的 GeForce RTX 4080 Founders Edition 與 GeForce RTX 3080 Ti Founders Edition 進行。
3DMark:
| 3DMark | GeForce RTX 3080 Ti Founders Edition | GeForce RTX 4080 Founders Edition | |
|---|---|---|---|
| TIme Spy | 19808 | 26952 | 26.506% |
| Graphic score | 19527 | 28267 | 30.919% |
| CPU score | 21567 | 21330 | -1.111% |
| Time Spy Extreme | 9800 | 13303 | 26.332% |
| Graphic score | 9758 | 14084 | 30.716% |
| CPU score | 10118 | 10123 | 0.049% |
| Fire Strike | 41988 | 51083 | 17.804% |
| Graphic score | 48770 | 67026 | 27.237% |
| Physics score | 43947 | 46040 | 4.546% |
| Combo score | 19902 | 19500 | -2.062% |
| Fire Strike Extreme | 23682 | 32443 | 27.004% |
| Graphic score | 24045 | 34074 | 29.433% |
| Physics score | 45377 | 45250 | -0.281% |
| Combo score | 12841 | 18193 | 29.418% |
| Fire Strike Ultra | 12654 | 17610 | 28.143% |
| Graphic score | 12319 | 17367 | 29.067% |
| Physics score | 45692 | 42596 | -7.268% |
| Combo score | 6729 | 9923 | 32.188% |
| Port Royal | 12984 | 17942 | 27.633% |
| Ray Tracing | 55.08 | 84.99 | 35.192% |
| Speed Way | 5202 | 7181 | 27.559% |
| CPU Profile | |||
| Max Threads | 12454 | 12594 | 1.112% |
| 16 threads | 1113 | 11208 | 90.070% |
| 8 threads | 8204 | 8250 | 0.558% |
| 4 threads | 4380 | 4384 | 0.091% |
| 2 threads | 2256 | 2237 | -0.849% |
| 1 threads | 1135 | 1137 | 0.176% |
1080p Gaming:
| 1080p GAMING | GeForce RTX 3080 Ti Founders Edition | GeForce RTX 4080 Founders Edition | |
|---|---|---|---|
| Assassin Creed Vahalla | 141 | 186 | 24.194% |
| Borderlands 3 : bad ass | 157.62 | 224.25 | 29.712% |
| Cyberpunk2077 | 141.81 | 189.79 | 25.281% |
| Cyberpunk2077(RT) | 66.91 | 103.7 | 35.477% |
| Tom Clancy’s The Division 2 | 228 | 284 | 19.718% |
| Metro Exodus | 145.67 | 185.22 | 21.353% |
| Metro Exodus(RT + High) | 121.8 | 154.77 | 21.303% |
| F1 22 | 241 | 252 | 4.365% |
| F1 22(RT + Ulta_High) | 125 | 156 | 19.872% |
| Far Cry 6 | 175 | 186 | 5.914% |
| Horizon Zero Dawn | 196 | 237 | 17.300% |
| Rainbow Six Siege | 740 | 776 | 4.639% |
| Shadow of the Tomb Raider | 252 | 293 | 13.993% |
| Total War: Troy | 205 | 252.2 | 18.715% |
| Watch Dog Legion | 131 | 176 | 25.568% |
| Watch Dog Legion(RT + Ultra) | 86 | 116 | 25.862% |
1440p Gaming:
| 1440p GAMING | GeForce RTX 3080 Ti Founders Edition | GeForce RTX 4080 Founders Edition | |
|---|---|---|---|
| Assassin Creed Vahalla | 114 | 150 | 24.000% |
| Borderlands 3 : bad ass | 117.14 | 163.23 | 28.236% |
| Cyberpunk2077 | 95.45 | 116.66 | 18.181% |
| Cyberpunk2077(RT) | 44.54 | 59.49 | 25.130% |
| Tom Clancy’s The Division 2 | 157 | 216 | 27.315% |
| Metro Exodus | 119.79 | 158.35 | 24.351% |
| Metro Exodus(RT + High) | 92.52 | 128.17 | 27.815% |
| F1 22 | 201 | 228 | 11.842% |
| F1 22(RT+ Ultra_High) | 87 | 113 | 23.009% |
| Far Cry 6 | 143 | 175 | 18.286% |
| Horizon Zero Dawn | 163 | 207 | 21.256% |
| Rainbow Six Siege | 623 | 714 | 12.745% |
| Shadow of the Tomb Raider | 190 | 260 | 26.923% |
| Total War: Troy | 159 | 201 | 20.896% |
| Watch Dog Legion | 103 | 141 | 26.950% |
| Watch Dog Legion(RT + Ultra) | 62 | 85 | 27.059% |
4K Gaming:
| 4K GAMING | GeForce RTX 3080 Ti Founders Edition | GeForce RTX 4080 Founders Edition | |
|---|---|---|---|
| Assassin Creed Vahalla | 72 | 94 | 23.404% |
| Borderlands 3 : bad ass | 67.54 | 88.65 | 23.813% |
| Cyberpunk2077 | 47.25 | 58.95 | 19.847% |
| Cyberpunk2077(RT) | 21.11 | 29.37 | 28.124% |
| Tom Clancy’s The Division 2 | 84 | 116 | 27.586% |
| Metro Exodus | 77.23 | 106.2 | 27.279% |
| Metro Exodus(RT + High) | 53.98 | 76.08 | 29.048% |
| F1 22 | 133 | 166 | 19.880% |
| F1 22(RT + Ultra_High) | 44 | 60 | 26.667% |
| Far Cry 6 | 88 | 111 | 20.721% |
| Horizon Zero Dawn | 95 | 117 | 18.803% |
| Rainbow Six Siege | 333 | 443 | 24.831% |
| Shadow of the Tomb Raider | 112 | 155 | 27.742% |
| Total War: Troy | 94.8 | 117.4 | 19.250% |
| Watch Dog Legion | 63 | 86 | 26.744% |
| Watch Dog Legion(RT + Ultra) | 34 | 47 | 27.660% |
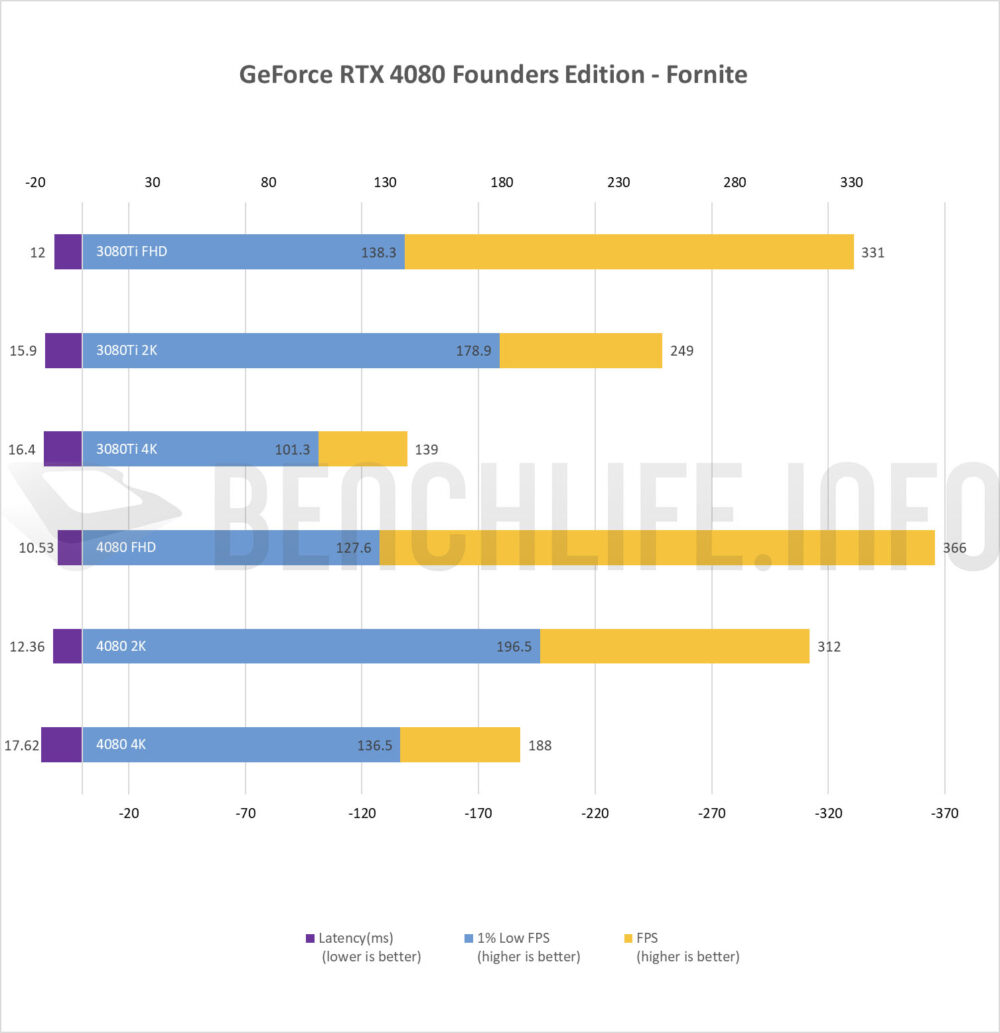
跟著我們看看 Intel Core i7-13700K 搭配 GeForce RTX 4080 Founders Edition 與搭配 GeForce RTX 3080 Ti Founders Edition 在 Fornite 這款遊戲時,整台電腦的 Latency、1% Low FPS 與 FPS 實際表現。
這項測試,我們一樣在 1080p、1440p 與 4K 等 3 種解析度下進行。
跟著我們來看看 GeForce RTX 4080 Founders Edition 的功耗表現,以平均 310W TGP 的預設模式,這張顯示卡的平均風扇轉速在 1600 RPM,GPU 平均溫度為 60.5 攝氏度,而 GPU Hot Spot 平均為 70.0 攝氏度。
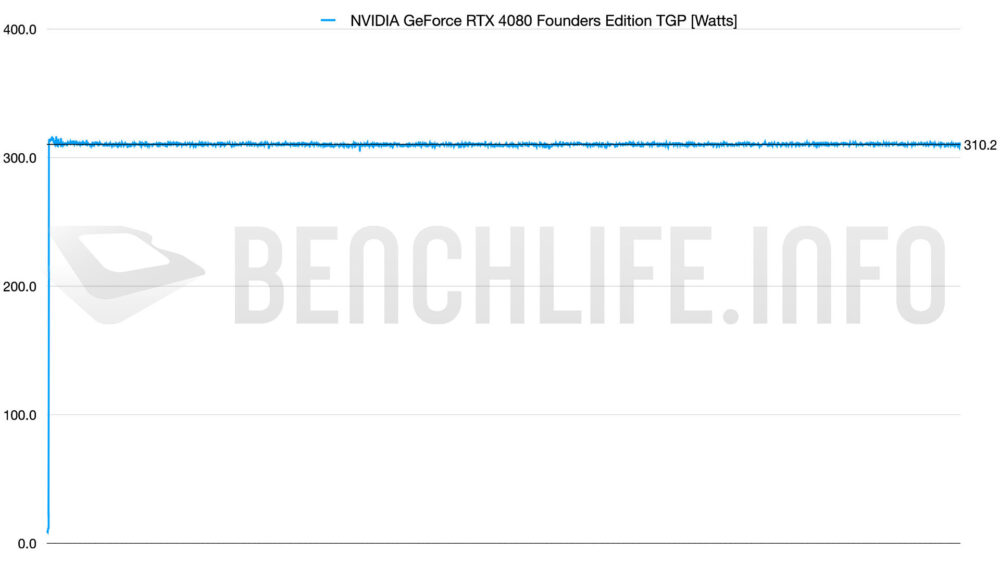
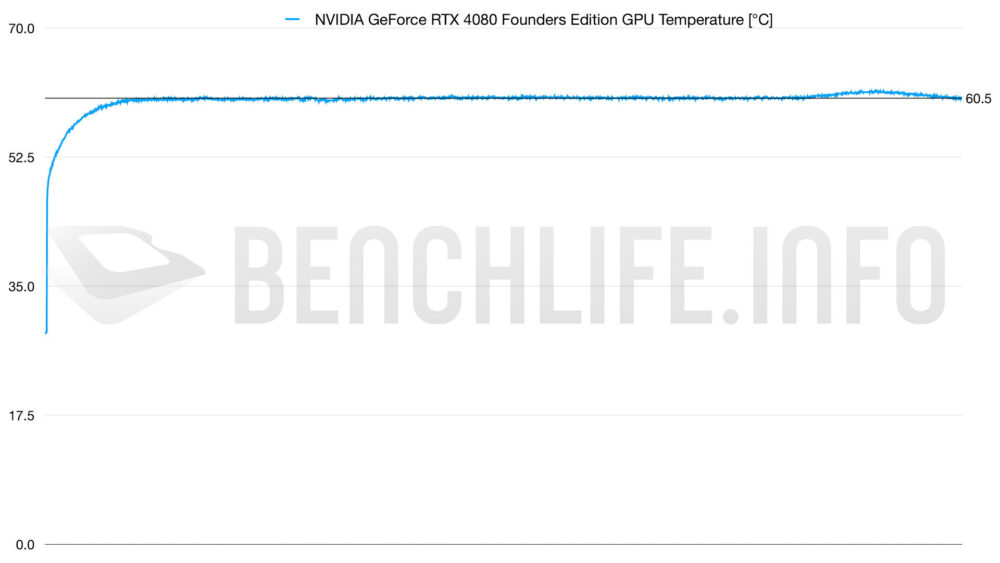
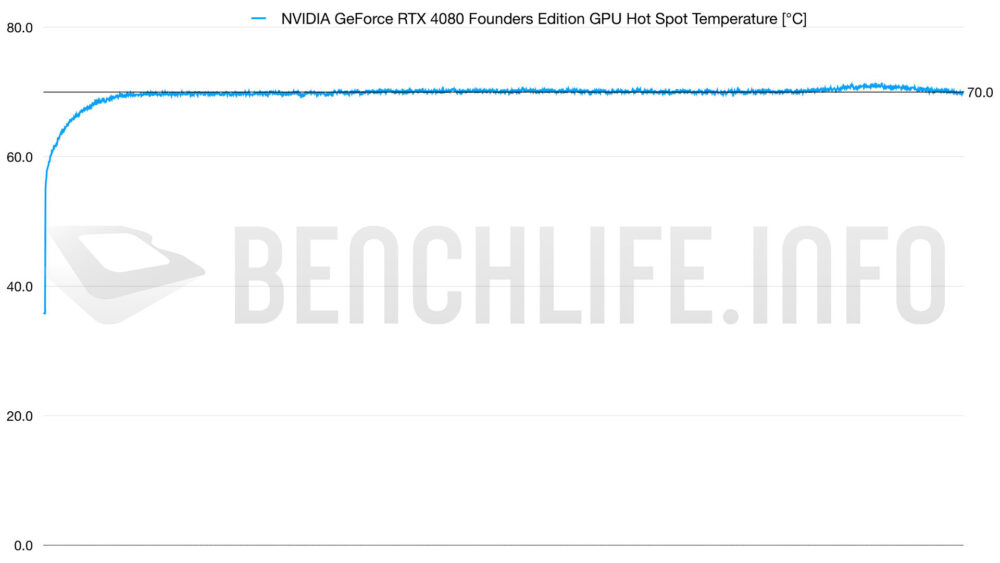
就我們前面所提到,NVIDIA GeForce RTX 4080 Founders Edition 與 GeForce RTX 4090 Founders Edition 的架構差異沒有太大,因此這樣的溫度表現是可以預期的好。
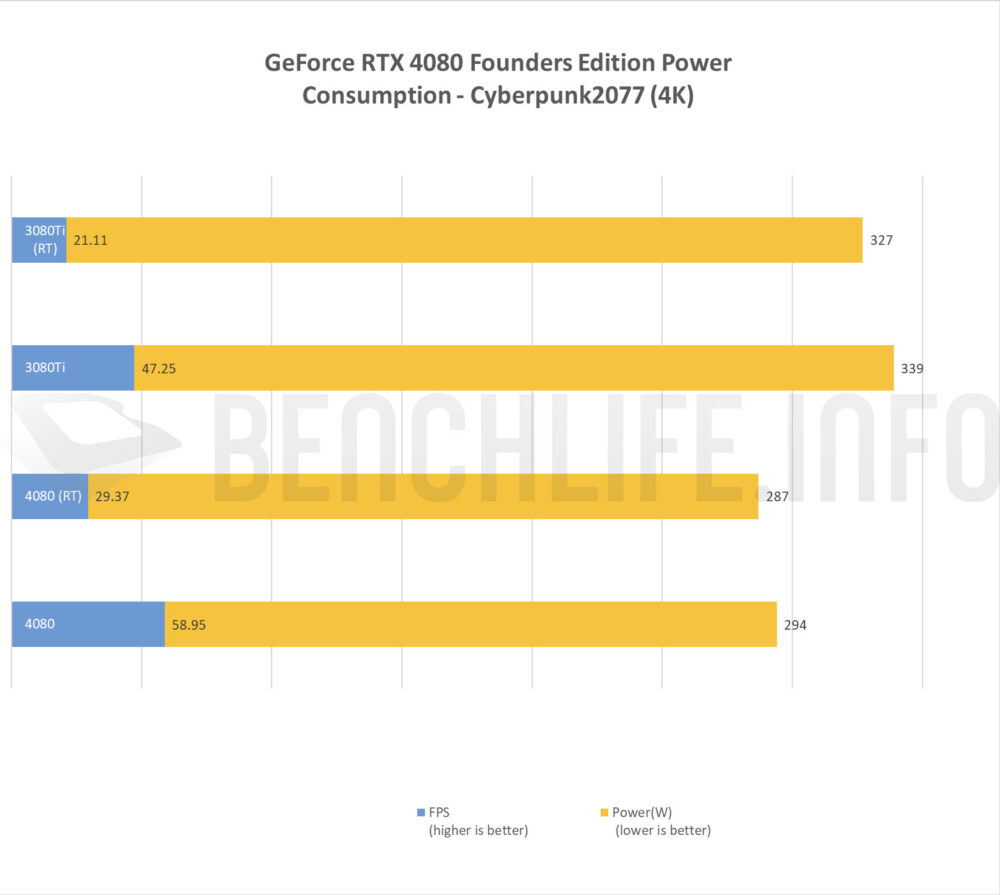
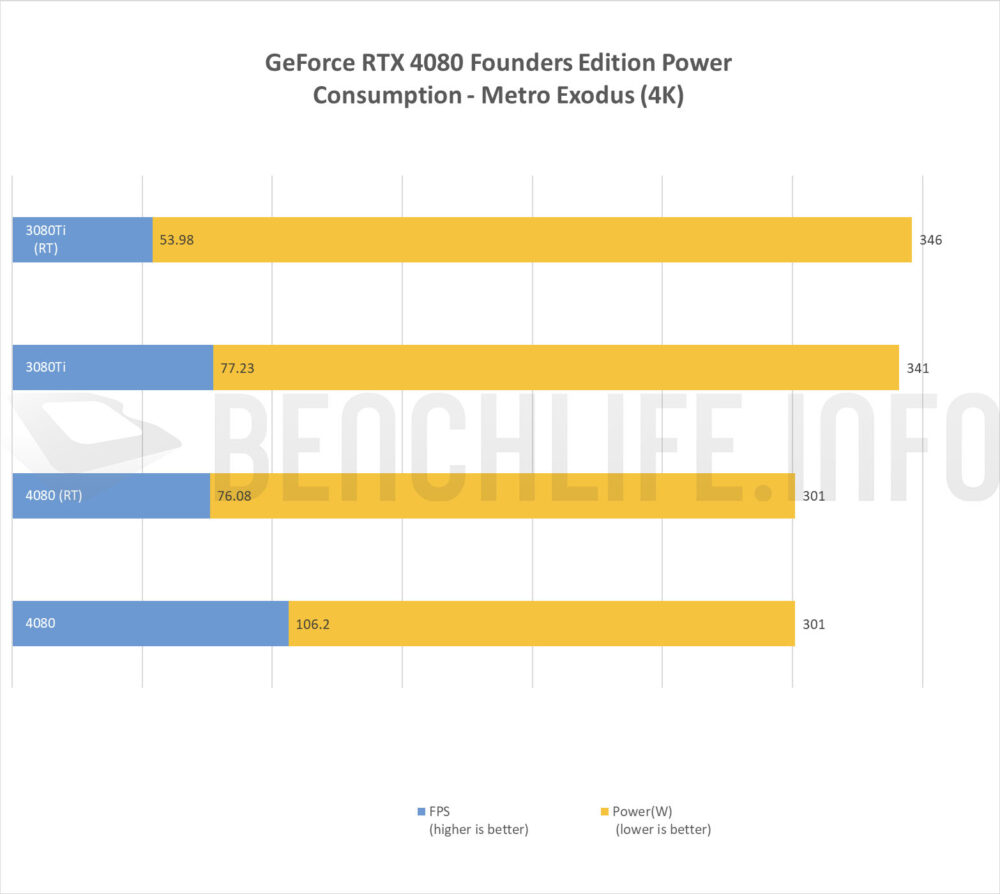
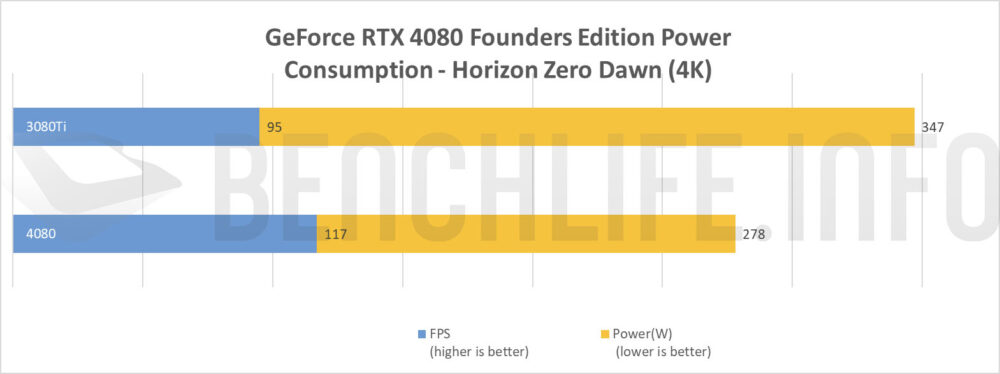
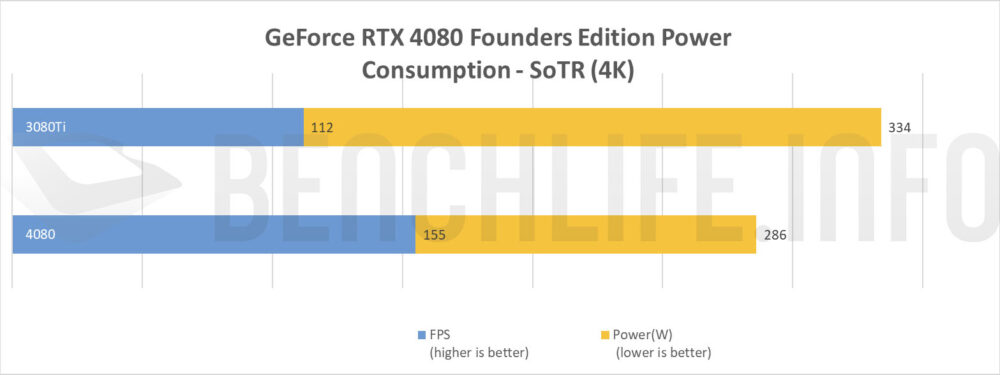
另一方面,在這次的 GeForce RTX 4080 Founders Edition 與 GeForce RTX 3080 Ti Founders Edition 比較測試中,我們也加入遊戲功耗表現讓大家做一個參考。
Cyberpunk2077:
Metro Exodus:
Horizon Zero Dawn:
SoTR:
NVIDIA GeForce RTX 4080 Founder Edition 與 GeForce RTX 4090 Founders Edition 效能差異在 25 – 35% 這個區間內,至於 2 款顯示卡的價差則是在 25%。
與 NVIDIA GeForce RTX 3080 Ti 相比較的話,全新 Ada Lovelace 架構的 GeForce RTX 4080 效能當然沒有太多可以質疑的,特別是在 4K Gaming 方面,至少都有接近 20% 的效能領先,對於想要入手進行 4K 遊戲的玩家,也許是一個相當不錯的選擇。
至於 12VHPWR 接頭與轉接線熔毀,目前只有等 NVIDIA 正式回應,但類似事件若是發生,各家 AIC 合作夥伴勢必會優先處理,只是使用者會較為麻煩,因為碰上了可能會有一陣子沒有顯示卡使用。
NVIDIA GeForce RTX 4080 這次率先出招,面對著即將在 12 月發售的 AMD Radeon RX 7900 XTX,到底這 2 款顯示卡誰較具優勢,目前無法下結論,但以 999 美元的 Radeon RX 7900 XTX 定價來說,若效能差異在 10% 左右,勢必會對 NVIDIA GeForce RTX 4080 造成一定困擾,不過 Ada Lovelace 架構有 Ray Tracing 與 DLSS 3 的優勢,後續更多遊戲支援的條件下,優勢可能會更為明顯。
至於 GeForce RTX 4080 與 Radeon RX 7900 XTX 間的效能差異,就留待到 12 月才能為大家揭露了。