沒有疑問,Founders Edition 再一次突破自己。
效能正式解禁,一起來看看 GeForce RTX 5090 與 GeForce RTX 4090 之間的差距到底有多大。
採用 Ada Lovelace GPU 架構的 GeForce RTX 4090,是 NVIDIA 在 2022 年 10 月推出的一款顯示卡。
回顧 Ada Lovelace GPU 架構的 GeForce RTX 40 系列重點:
1. 新的 Streaming Multiprocessors(SM)
2. 4th Gen Tensor Cores 與 Optical Flow
3. 3rd Gen RT Cores
4. Shader Execution Reordering(SER)
5. DLSS 3
6. NVIDIA Studio
7. AV1 Encoders
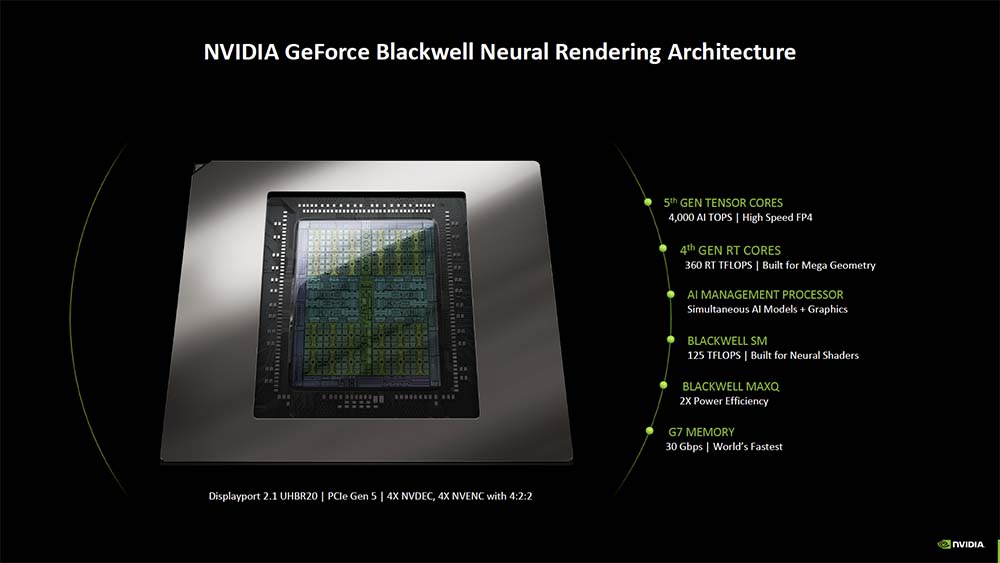
到了 2025 年 1 月,NVIDIA 在 CES 2025 正式公佈了 Blackwell GPU 架構的 GeForce RTX 50 系列顯示卡,雖然與 Ada Lovelace 同樣為 TSMC 4N 製程,但全新的 Blackwell GPU 架構的 AI 神經渲染(Neural Rendering)與神經著色技術(Neural Shading),能加速開發者在其所開發應用中的 AI 運算比例,這裡面包含 AI 渲染和模擬技術的實現與即時應用。
Blackwell GPU 架構的 GeForce RTX 50 系列重點:
1. 專為神經著色(Neural Shading)設計的全新 SM 功能;
2. 全新 MaxQ 功能,帶來更佳的電源效率;
3. 4th Gen RT Cores;
4. 5th Gen Tensor Cores;
5. NVIDIA DLSS 4;
6. RTX 神經著色器(Neural Shaders);
7. AI 管理處理器(AMP);
8. GDDR7 記憶體;
9. Mega Geometry Technology;
NVIDIA GeForce RTX 5090 使用的是代號 GB202 的 Blackwell 架構 GPU,在目前整個 GeForce RTX 50 系列中,屬於最高階的產品。以目前所揭露的資訊,在 GB202 之下,還有 GeForce RTX 5080 與 GeForce RTX 5070 Ti 使用的 GB203,以及 GeForce RTX 5070 的 GB205。
Blackwell aka NVIDIA GeForce RTX 50 Series
| GeForce RTX 5070 | GeForce RTX 5070 Ti | GeForce RTX 5080 | GeForce RTX 5090 | |
| GPU Codename | GB205 | GB203 | GB203 | GB202 |
| Architecture | Blackwell | |||
| Transistor Count | 31.1B | 45.6B | 45.6B | 92.2B |
| Die Size | 263mm2 | 378mm2 | 378mm2 | 750mm2 |
| Process | TSMC 4nm 4N | |||
| PCIe Interface | Gen 5.0 | |||
| GPCs | 5 | 6 | 7 | 11 |
| TPCs | 24 | 35 | 42 | 85 |
| SMs | 48 | 70 | 84 | 170 |
| CUDA Cores|SM | 128 | 128 | 128 | 128 |
| CUDA Cores|GPU | 6144 | 8960 | 10752 | 21760 |
| Tensor Cores|SM(5th Gen) | 4 | |||
| Tensor Cores|GPU(5th Gen) | 192 | 280 | 336 | 680 |
| GPU Boost Clock | 2512 MHz | 2452 MHz | 2617 MHz | 2407 MHz |
| RT Cores(4th Gen) | 48 | 70 | 84 | 170 |
| GDDR7 | 12GB | 16GB | 16GB | 32GB |
| Memory Interface | 192 bit | 256 bit | 256 bit | 512 bit |
| Memory Clock | 28 Gbps | 28 Gbps | 30 Gbps | 28 Gbps |
| Memory Bandwidth | 672 GB/s | 896 GB/s | 960 GB/s | 1792 GB/s |
| ROPs | 80 | 96 | 112 | 176 |
| Pixel Fill-rate | 201 GT/s | 235.4 GT/s | 293.1 GT/s | 423.6 GT/s |
| Texture Units | 192 | 280 | 336 | 680 |
| Texel Fill-rate | 482.3 GT/s | 686.6 GT/s | 879.3 GT/s | 1636.8 GT/s |
| L1 Data Cache | 6144KB | 8960KB | 10752KB | 21760KB |
| L2 Cache | 49152KB | 49152KB | 65536KB | 98304KB |
| Register Fill Size | 12288KB | 17920KB | 21504KB | 43520KB |
| NVENC(9th Gen) | 1x | 2x | 2x | 3x |
| NVDEC(6th Gen) | 1x | 1x | 2x | 2x |
| TGP(Total Graphics Power) | 250W | 300W | 360W | 575W |
GB202 擁有 12 GPCs(Graphics Processing Clusters)、96 TPCs(Texture Processing Clusters)、192 SMs(Streaming Multiprocessors)以及 512 bit 記憶體介面。
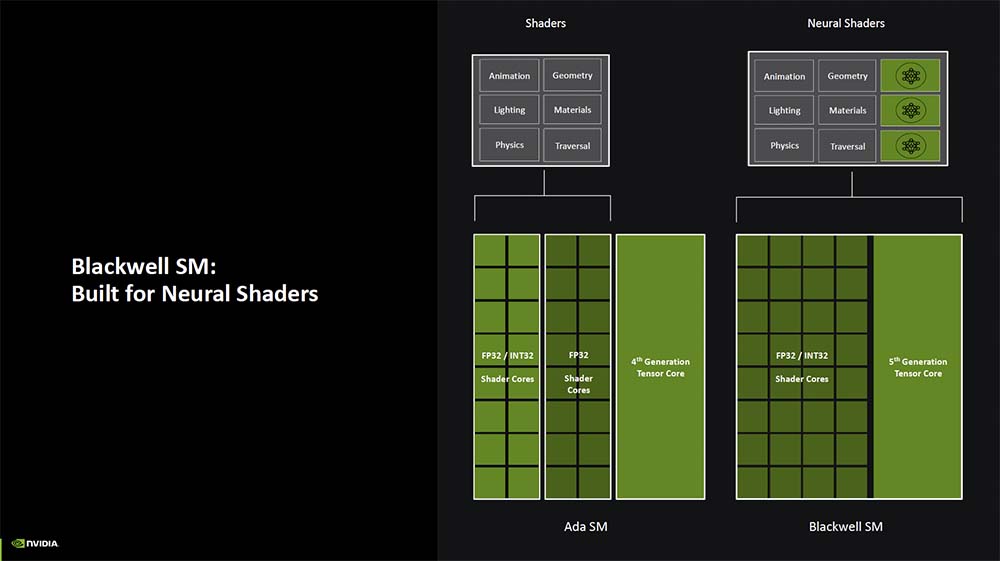
4th Gen RT Cores 與 5th Gen Tensor Cores 是 2 個世代 GPU 架構很大的差異,但更仔細來看的話,Ada Lovelace 的 SM 是為了標準的著色器進行設計與規劃,而 Blackwell 的 SM 則是為了神經著色器(Neural Shaders)去設計與優化。
因為 Neural Rendering 導入因素,Blackwell GPU 架構的 Streaming Multiprocessor 的 Shader Core 一律可操作 INT32 / FP32 資歷。
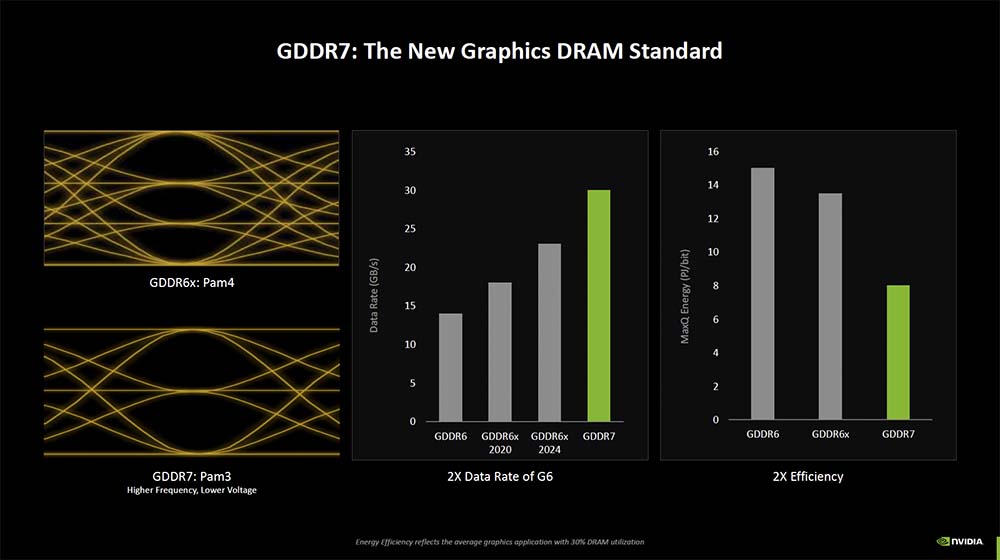
搭配上新世代的 GDDR7 記憶體,可以讓顯示卡提供更高的記憶體頻寬,這前提是在電壓更低的條件下達成。
以 GeForce RTX 4090 的 21Gbps GDDR6x 來說, 其最高的記憶體頻寬為 1TB/s,而 GeForce RTX 5090 的 28Gbps GDDR7 則可以達到 1.792TB/s;GeForce RTX 5080 的 GDDR7 記憶體時脈為 30Gbps。
延伸閱讀 – NVIDIA Editor’s Day 2025:GeForce RTX 50 系列 Blackwell 架構多面相再進化
第 4 代 RT 核心部分,新增支援 Linear-swept Spheres,光線、路徑與三角形相交的檢測如今能夠以叢集(cluster)的方式進行,提升檢測時的效能。
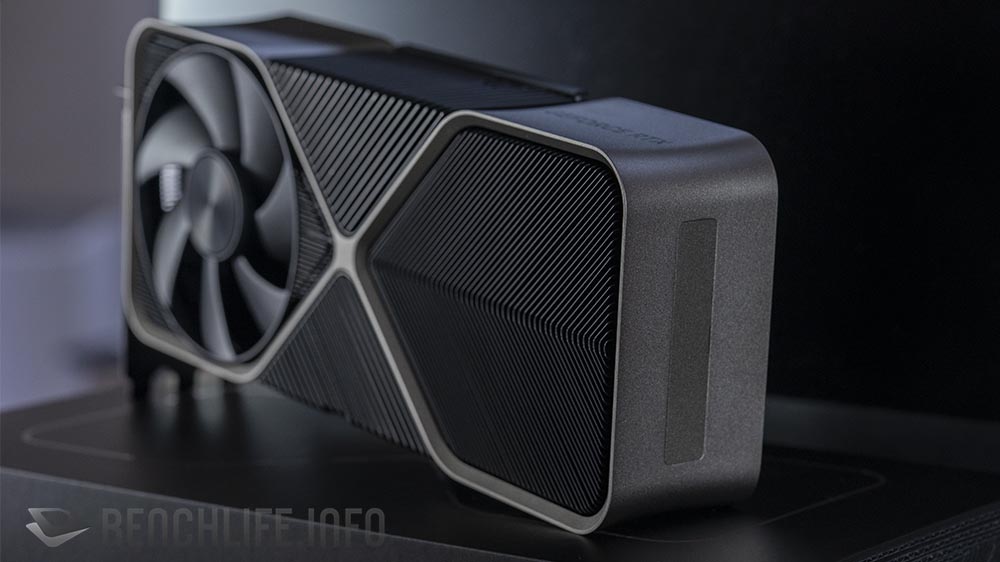
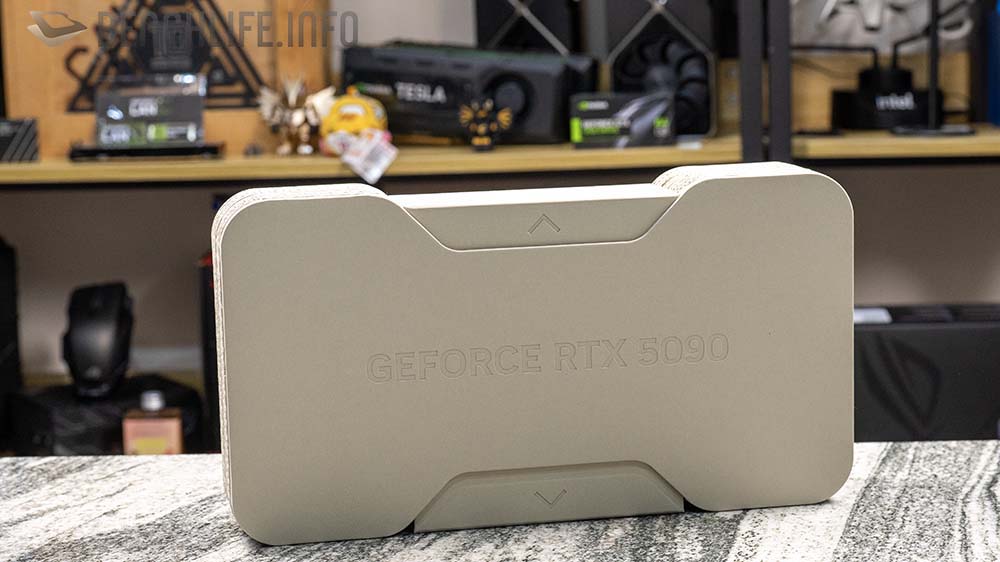
前面介紹太多,跟著我們來看看這次測試的對象 – GeForce RTX 5090 Founders Edition。
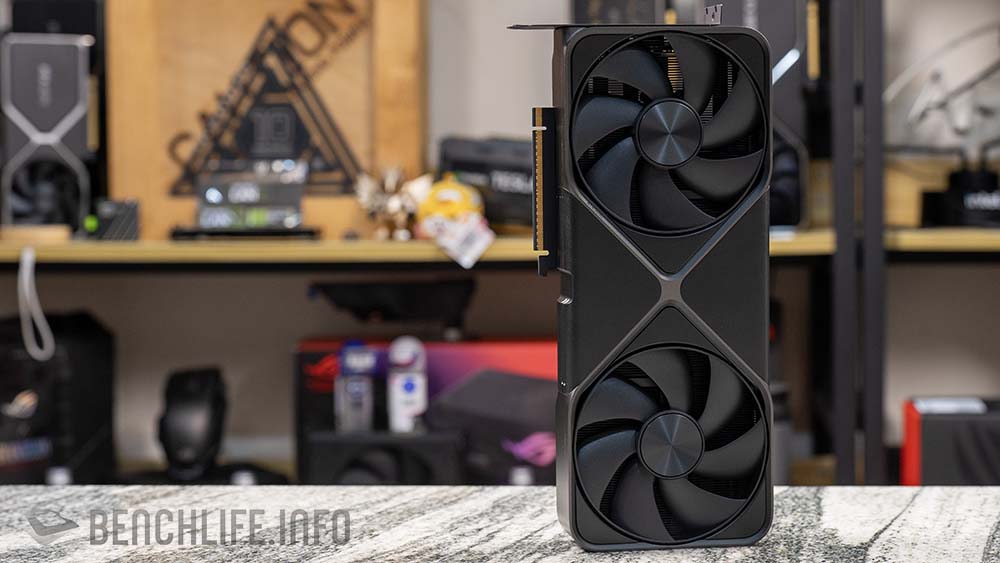
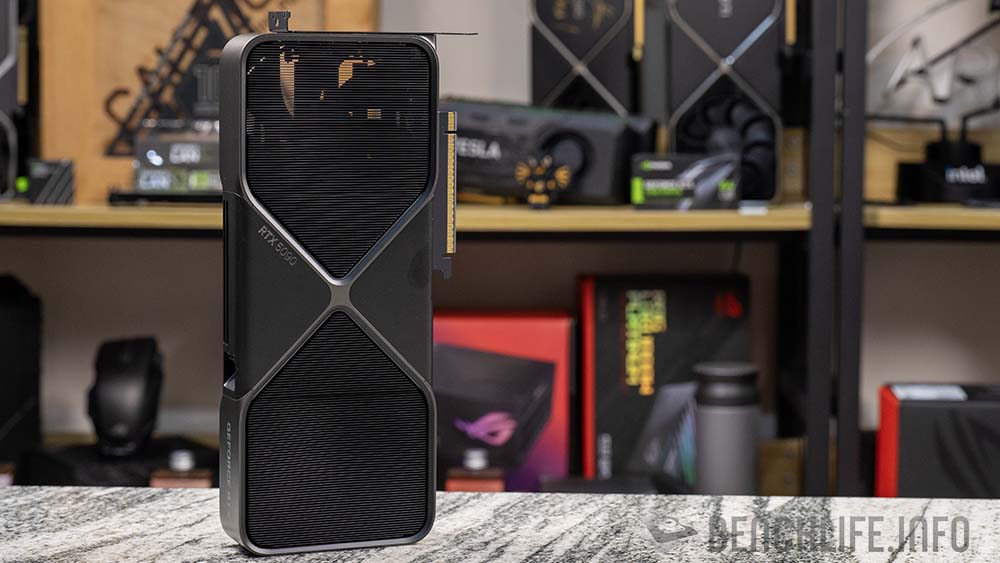
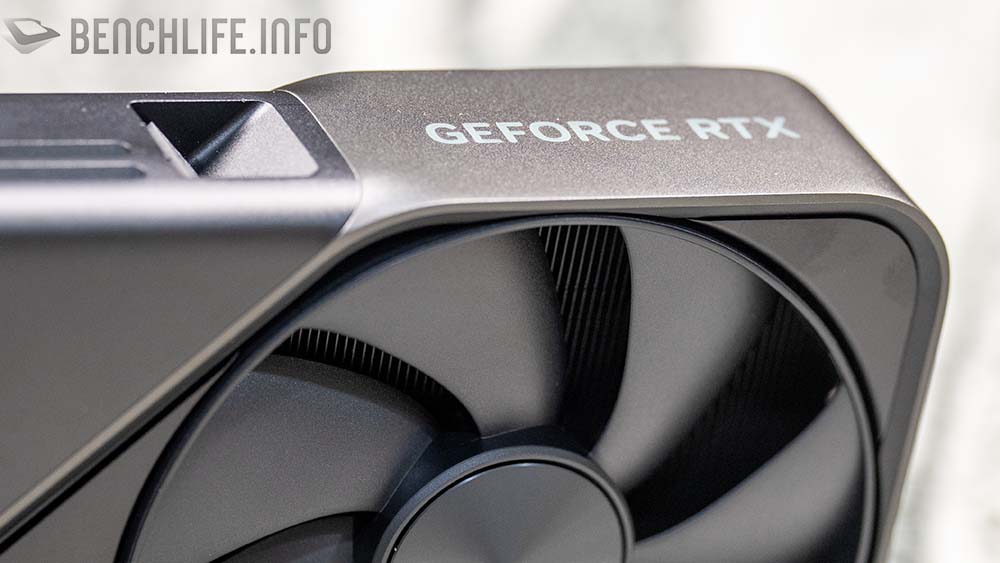
在一眾 GeForce RTX 5090 面前,2 槽設計的 Founders Edition 採用 3D Vapor Chamber + 5 根熱導管,並透過 3 組鰭片散熱,以及打破過去一張 PCB 的設計,讓 NVIDIA GeForce RTX 5090 Founders Edition 它根本是無敵的存在。
Double Axial Double flow through 是 GeForce RTX 5090 Founders Edition 散熱器想要強調的部分。
過去我們常見到的顯示卡大多是單一張 PCB 可以見到 GPU、DRAM、I/O 與 PCIe 金手指,但這次 Founders Edition 改成 GPU + DRAM、I/O 與 PCIe 金手指等 3 個部分,透過鍛造的外殼進行結合。
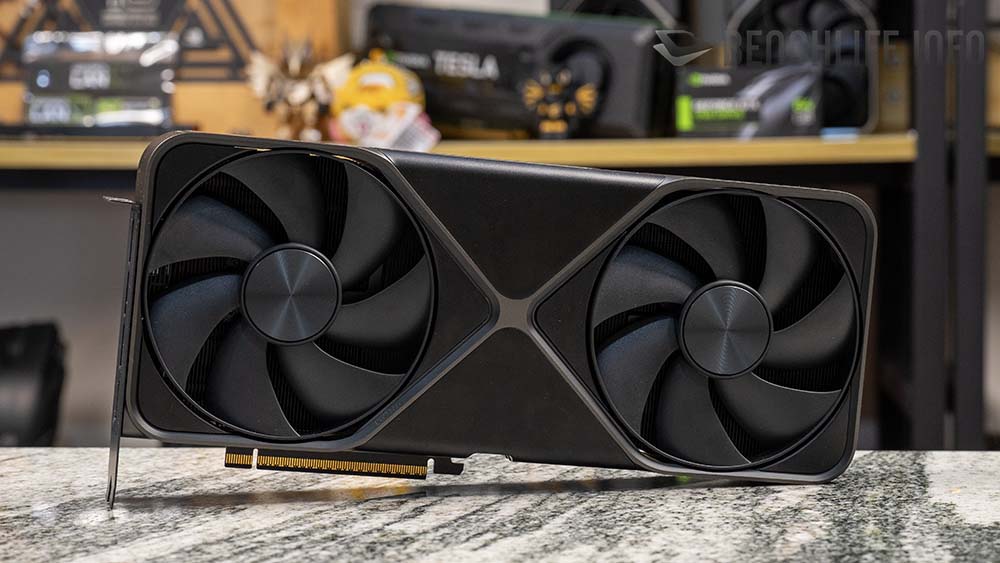
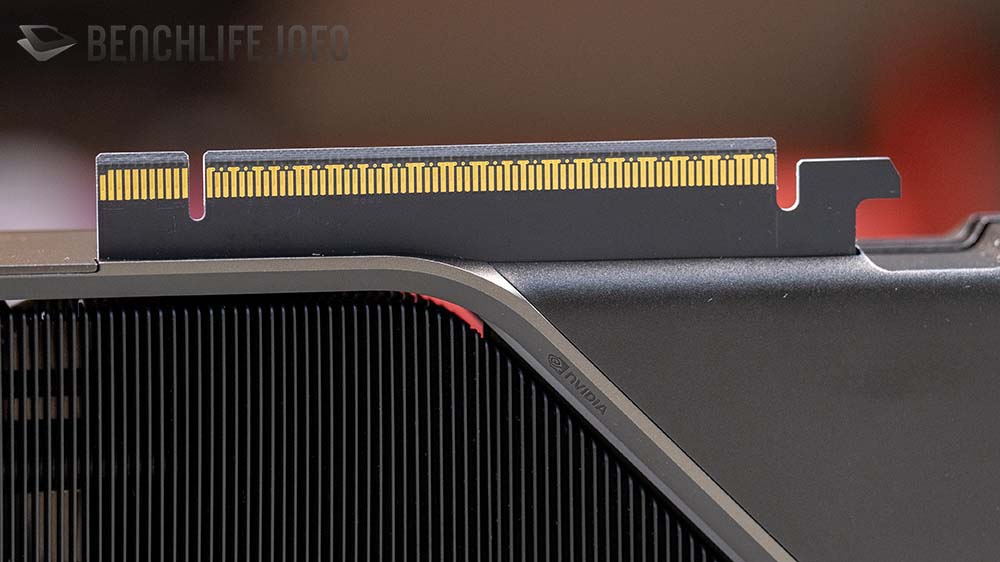
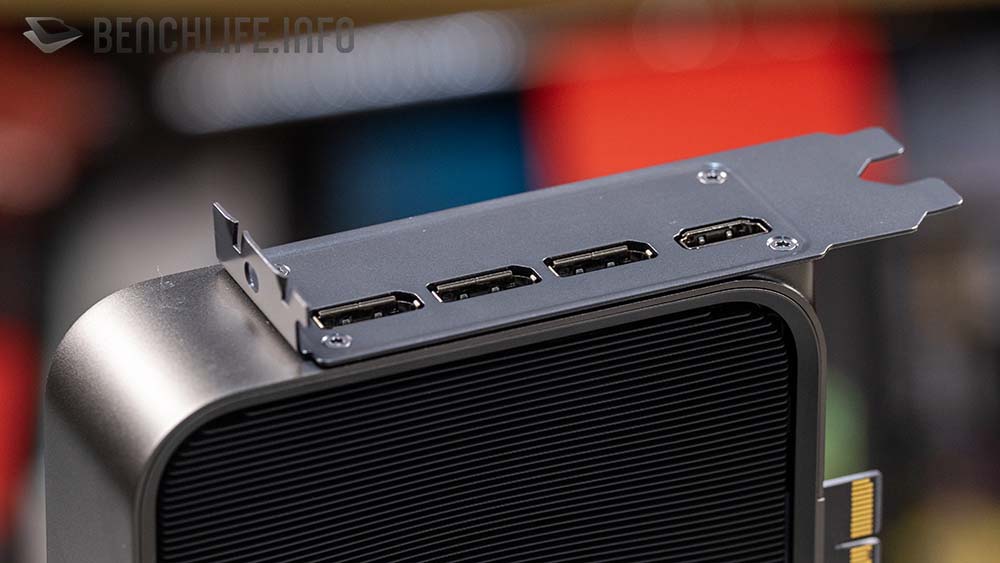
GeForce RTX 5090 提供 3x DisplayPort 2.1b(UHBR20)+ 1x HDMI 2.1b 供使用。
PCIe 5.0 金手指與 GPU + DRAM PCB 是透過 Amphenol 的 MiniStak High Density High Speed 0.6mm Board-to-Board Connector 進行資料傳輸。
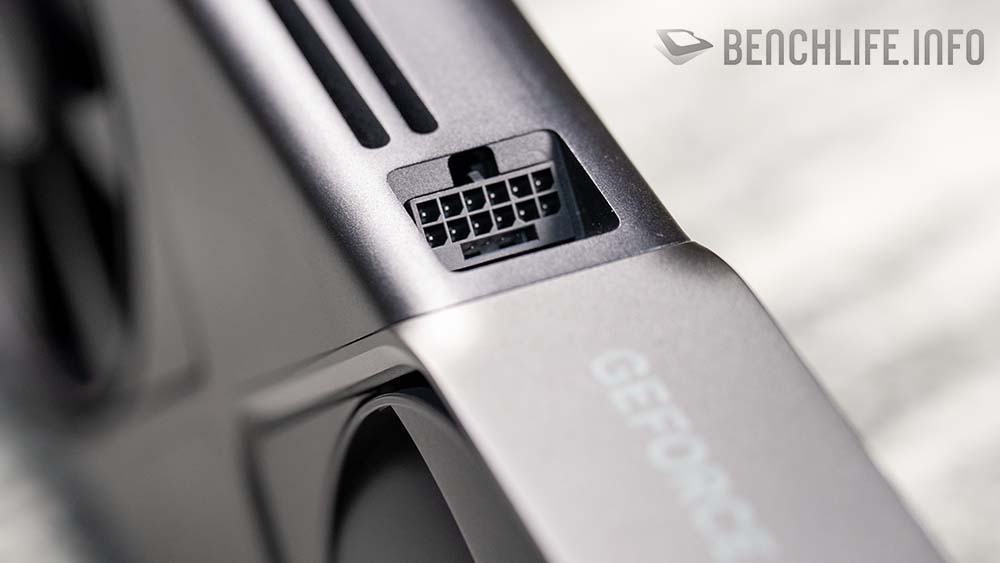
這次 NVIDIA 的供電接頭更換至 12V-2×6 接頭,相較於過去的 12VHPWR 接頭,全新的接頭有著更佳以及更可靠的設計。
延伸閱讀 – 技術、設計、美學並帶有環保概念,NVIDIA GeForce RTX 5090 Founders Edition 入手
效能測試部分,除了 NVIDIA GeForce RTX 4090 外,同時也有與 AMD Radeon RX 7900 XTX 一起做比較,雖然它並不是同一個級別的顯示卡;測試平台部分使用 AMD Ryzen 7 9800X3D 搭配 ROG Crosshair X870E Hero 與 DDR5-6800 MT/s 記憶體進行測試。
先看看 GeForce RTX 5090 Founders Edition 與 Radeon RX 7900 XTX 的比較。
3DMark - GeForce RTX 5090 vs Radeon RX 7900 XTX
| 3DMark | Radeon RX 7900 XTX | GeForce RTX 5090 | |
| TIme Spy | 27171 | 37135 | 26.832% |
| Graphic score | 31111 | 48659 | 36.063% |
| CPU score | 15821 | 15856 | 0.221% |
| TIme Spy Extreme | 13074 | 18642 | 29.868% |
| Graphic score | 15078 | 25537 | 40.956% |
| CPU score | 7458 | 7347 | -1.511% |
| Fire Strike | 54151 | 60902 | 11.085% |
| Graphic score | 76024 | 95794 | 20.638% |
| Physics score | 39541 | 39847 | 0.768% |
| Combo score | 20799 | 20721 | -0.376% |
| Fire Strike Extreme | 35280 | 45926 | 23.181% |
| Graphic score | 38771 | 56661 | 31.574% |
| Physics score | 39852 | 39374 | -1.214% |
| Combo score | 19100 | 21151 | 9.697% |
| Fire Strike Ultra | 19781 | 31004 | 36.199% |
| Graphic score | 20070 | 32166 | 37.605% |
| Physics score | 39943 | 40053 | 0.275% |
| Combo score | 10742 | 19263 | 44.235% |
| Portal Royal | 16471 | 36098 | 54.371% |
| Speed Way | 6212 | 14432 | 56.957% |
| DXR | 57.15 | 109.27 | 47.698% |
| Bandwidth | 26.87 | 36.7 | 26.785% |
DirectX 12 部分的 Time Spy 與 Time Spy Extreme 差距在 36% 與 40%;DirectX 11 部分的 Fire Strike 系列測試在 20% 至 37% 之間。
GeForce RTX 5090 在 Port Royal 領先 Radeon RX 7900 XTX 多達 54%。
DXR Features Test 效能部分存在已知問題,但 2 張顯示卡仍舊有 47% 的差距。
另外,因為 GeForce RTX 5090 為 PCIe 5.0 規格顯示卡,可以見到其 Bandwidth 達到 36.7GB/s。
4K Gaming - GeForce RTX 5090 vs Radeon RX 7900 XTX
| 4K Gaming | Radeon RX 7900 XTX | GeForce RTX 5090 | |
| Alan wake 2 | |||
| ULTRA_DLAA | 51.9 | 85 | 38.941% |
| RT_DLAA | N/A | 44 | - |
| RT_FG_DLAA | N/A | 83 | - |
| RT_FG_4X_DLAA | N/A | 152 | - |
| Assassin's Creed Valhalla | 108 | 137 | 21.168% |
| Black Wukong | |||
| Cinematic | N/A | 63 | - |
| Cinematic_RT | N/A | 31 | - |
| Cinematic_RT_FG_Balacne | N/A | 96 | - |
| Borderlands 3(ULTRA|DirectX 12) | 114.8 | 172.39 | 33.407% |
| CS2(VERY HIGH) | 152.4 | 305.1 | 50.049% |
| Cyberpunk 2077 | |||
| ULTRA | 64.04 | 110.96 | 42.286% |
| RT_ULTRA | 21.11 | N/A | - |
| PT | 8.83 | 33.72 | 73.814% |
| PT_Balanced_FG | 43.41 | 134.3 | 67.677% |
| PT_Balanced_FG_4X|DLSS4 | N/A | 242.01 | - |
| F1 24 | |||
| ULTRA HIGH | 60 | 128 | 53.125% |
| Upscale_Quality + FG | N/A | 232 | - |
| Final Fantasy 14 Dawntrail | 169.4 | 295.34 | 42.642% |
| Guardian of Galaxy(ULTRA|RT_ULTRA) | 58 | 144 | 59.722% |
| Horizon Zero Dawn Remaster | 100 | 147 | 31.973% |
| Metro Exodus(UTLRA) | 100.47 | 163.21 | 38.441% |
| Rainbow Six Siege(ULTRA|VULKAN) | 265 | 478 | 44.561% |
| Shadow of the Tomb Raide(HIGHEST) | 132 | 237 | 44.304% |
| StarWars Outlaw | |||
| ULTRA | N/A | 29 | - |
| DLSS_Balanced_FG 2X|DLSS 3 | N/A | N/A | - |
| DLSS_Balanced_FG 4X | N/A | 234 | - |
| Total War:War Hammer 3 | 86.2 | 139.6 | 38.252% |
4K 解析度(3840 x 2160)遊戲方面,GeForce RTX 5090 的領先幅度都相當高,除了在 Assassin’s Creed Valhalla 這款遊戲只有 21% 左右的差距。
1440p Gaming - GeForce RTX 5090 vs Radeon RX 7900 XTX
| 1440p Gaming | Radeon RX 7900 XTX | GeForce RTX 5090 | |
| Alan wake 2 | |||
| ULTRA_DLAA | 102.51 | 148 | 30.736% |
| RT_DLAA | N/A | 80 | - |
| RT_FG_DLAA | N/A | 145 | - |
| RT_FG_4X_DLAA | N/A | 263 | - |
| Assassin's Creed Valhalla | 166 | 198 | 16.162% |
| Black Wukong | |||
| Cinematic | N/A | 91 | - |
| Cinematic_RT | N/A | 60 | - |
| Cinematic_RT_FG_Balacne | N/A | 148 | - |
| Borderlands 3(ULTRA|DirectX 12) | 201.22 | 294.29 | 31.625% |
| CS2(VERY HIGH) | 318.5 | 540.1 | 41.029% |
| Cyberpunk 2077 | |||
| ULTRA | 135.53 | 207.02 | 34.533% |
| RT_ULTRA | 43.09 | N/A | - |
| PT | 19.01 | 66.25 | 71.306% |
| PT_Balanced_FG | 86.82 | 216.35 | 59.871% |
| PT_Balanced_FG_4X|DLSS4 | N/A | 386.73 | - |
| F1 24 | |||
| ULTRA HIGH | 114 | 203 | 43.842% |
| Upscale_Quality + FG | N/A | 325 | - |
| Final Fantasy 14 Dawntrail | 339.53 | 435.87 | 22.103% |
| Guardian of Galaxy(ULTRA|RT_ULTRA) | 106 | 241 | 56.017% |
| Horizon Zero Dawn Remaster | 159 | 201 | 20.896% |
| Metro Exodus(UTLRA) | 144.7 | 214.5 | 32.541% |
| Rainbow Six Siege(ULTRA|VULKAN) | 430 | 638 | 32.602% |
| Shadow of the Tomb Raide(HIGHEST) | 236 | 371 | 36.388% |
| StarWars Outlaw | |||
| ULTRA | N/A | 58 | - |
| DLSS_Balanced_FG 2X|DLSS 3 | N/A | N/A | - |
| DLSS_Balanced_FG 4X | N/A | 382 | - |
| Total War:War Hammer 3 | 159.9 | 228.9 | 30.144% |
1440p(2560 x 1440)解析度遊戲測試部分,與 4K 解析度相同,可以見到 Assassin’s Creed Valhalla 這款遊戲的差距最小。
AI Benchmark - GeForce RTX 5090 vs Radeon RX 7900 XTX
| Radeon RX 7900 XTX | GeForce RTX 5090 | ||
| Geekbench 6 | |||
| OpenCL | 6341 | 371011 | 98.291% |
| Vulkan | 227831 | 390244 | 41.618% |
| Geekbench AI | |||
| Single Precision | 35140 | 44703 | 21.392% |
| Half Precision | 38682 | 64430 | 39.963% |
| Quantized | 26995 | 32755 | 17.585% |
| Procyon AI image generation | |||
| SD 1.5|INT8 | N/A | N/A | - |
| SD 1.5|FP16 | 1954 | 5168 | 62.190% |
| SDXL|FP16 | 1454 | 5168 | 71.865% |
| Procyon AI image generation beta(FLUX) | (LESS IS BETTER) | ||
| Flux.de(FP8)s/image | N/A | 6.61 | - |
| Flux.dev(FP4)s/image | N/A | 3.988 | - |
| Procyon AI text generation | |||
| Phi-3.5-mini-instruct(Tokens/s) | 168.33 | 316.52 | 46.819% |
| Mistral 7B(Tokens/s) | 119.35 | 261.2 | 54.307% |
| Llama3-8B(Tokens/s) | 104.69 | 217.86 | 51.946% |
| LLama2-13B(Tokens/s) | 71.96 | 136 | 47.088% |
在 AI 運算部分,GeForce RTX 5090 與 Radeon RX 7900 XTX 的差距更為明顯。
跟著來看看 GeForce RTX 5090 Founders Edition 與 GeForce RTX 4090 Founders Edition 的比較。
3DMark - GeForce RTX 5090 vs GeForce RTX 4090
| 3DMark | GeForce RTX 4090 | GeForce RTX 5090 | |
| TIme Spy | 30922 | 37135 | 16.731% |
| Graphic score | 37035 | 48659 | 23.889% |
| CPU score | 15979 | 15856 | -0.776% |
| TIme Spy Extreme | 15446 | 18642 | 17.144% |
| Graphic score | 19110 | 25537 | 25.167% |
| CPU score | 7404 | 7347 | -0.776% |
| Fire Strike | 55394 | 60902 | 9.044% |
| Graphic score | 78570 | 95794 | 17.980% |
| Physics score | 40304 | 39847 | -1.147% |
| Combo score | 20899 | 20721 | -0.859% |
| Fire Strike Extreme | 39441 | 45926 | 14.121% |
| Graphic score | 44507 | 56661 | 21.450% |
| Physics score | 39687 | 39374 | -0.795% |
| Combo score | 21173 | 21151 | -0.104% |
| Fire Strike Ultra | 24210 | 31004 | 21.913% |
| Graphic score | 24469 | 32166 | 23.929% |
| Physics score | 40493 | 40053 | -1.099% |
| Combo score | 14429 | 19263 | 25.095% |
| Portal Royal | 26043 | 36098 | 27.855% |
| Speed Way | 10186 | 14432 | 29.421% |
| DXR | 137.86 | 109.27 | -26.165% |
| Bandwidth | 26.89 | 36.7 | 26.730% |
3DMark 的 DirectX 12 與 DirectX 11 測試部分,不難見到,基本上 GeForce RTX 5090 與 GeForce RTX 4090 的差距在 20% 左右,最高則是接近 24%。
4K Gaming - GeForce RTX 5090 vs GeForce RTX 4090
| 4K Gaming | GeForce RTX 4090 | GeForce RTX 5090 | |
| Alan wake 2 | |||
| ULTRA_DLAA | 73.1 | 85 | 14.000% |
| RT_DLAA | 40.6 | 44 | 7.727% |
| RT_FG_DLAA | 75.72 | 83 | 8.771% |
| RT_FG_4X_DLAA | N/A | 152 | |
| Assassin's Creed Valhalla | 116 | 137 | 15.328% |
| Black Wukong | |||
| Cinematic | 50 | 63 | 20.635% |
| Cinematic_RT | 24 | 31 | 22.581% |
| Cinematic_RT_FG_Balacne | 86 | 96 | 10.417% |
| Borderlands 3(ULTRA|DirectX 12) | 147.03 | 172.39 | 14.711% |
| CS2(VERY HIGH) | 234 | 305.1 | 23.304% |
| Cyberpunk 2077 | |||
| ULTRA | 75.67 | 110.96 | 31.804% |
| RT_ULTRA | N/A | N/A | - |
| PT | 24.21 | 33.72 | 28.203% |
| PT_Balanced_FG | 101.43 | 134.3 | 24.475% |
| PT_Balanced_FG_4X|DLSS4 | N/A | 242.01 | - |
| F1 24 | |||
| ULTRA HIGH | 96 | 128 | 25.000% |
| Upscale_Quality + FG | 215 | 232 | 7.328% |
| Final Fantasy 14 Dawntrail | 233.83 | 295.34 | 20.827% |
| Guardian of Galaxy(ULTRA|RT_ULTRA) | 105 | 144 | 27.083% |
| Horizon Zero Dawn Remaster | 131 | 147 | 10.884% |
| Metro Exodus(UTLRA) | 135.17 | 163.21 | 17.180% |
| Rainbow Six Siege(ULTRA|VULKAN) | 396 | 478 | 17.155% |
| Shadow of the Tomb Raide(HIGHEST) | 184 | 237 | 22.363% |
| StarWars Outlaw | |||
| ULTRA | 21 | 29 | 27.586% |
| DLSS_Balanced_FG 2X|DLSS 3 | 106 | N/A | - |
| DLSS_Balanced_FG 4X | N/A | 234 | - |
| Total War:War Hammer 3 | 105.6 | 139.6 | 24.355% |
基本上,遊戲測試與 3DMark 的測試沒有太大差異,GeForce RTX 5090 與 GeForce RTX 4090 的差距就那樣。
然而,GeForce RTX 5090 在 DLSS 4 支援的遊戲下,確實如 NVIDIA 所述,可以提升 FSP 表現。就以 Cyberpunk 2077 的測試來看,開啟 Frame Generated 4X + DLSS 4 的條件下,FPS 可以達到 242.01,但 GeForce RTX 4090 在 Frame Generated 條件下,FPS 只有 101.43。
另一款支援 DLSS 4 的遊戲,StarWars Outlaw 也可以見到 GeForce RTX 5090 的優勢。
1440p Gaming - GeForce RTX 5090 vs GeForce RTX 4090
| 1440p Gaming | GeForce RTX 4090 | GeForce RTX 5090 | |
| Alan wake 2 | |||
| ULTRA_DLAA | 119.2 | 148 | 19.459% |
| RT_DLAA | 75.3 | 80 | 5.875% |
| RT_FG_DLAA | 133.7 | 145 | 7.793% |
| RT_FG_4X_DLAA | N/A | 263 | - |
| Assassin's Creed Valhalla | 182 | 198 | 8.081% |
| Black Wukong | |||
| Cinematic | 76 | 91 | 16.484% |
| Cinematic_RT | 46 | 60 | 23.333% |
| Cinematic_RT_FG_Balacne | 131 | 148 | 11.486% |
| Borderlands 3(ULTRA|DirectX 12) | 244.77 | 294.29 | 16.827% |
| CS2(VERY HIGH) | 400 | 540.1 | 25.940% |
| Cyberpunk 2077 | |||
| ULTRA | 159.04 | 207.02 | 23.177% |
| RT_ULTRA | N/A | N/A | - |
| PT | 49.6 | 66.25 | 25.132% |
| PT_Balanced_FG | 185.21 | 216.35 | 14.393% |
| PT_Balanced_FG_4X|DLSS4 | N/A | 386.73 | - |
| F1 24 | |||
| ULTRA HIGH | 163 | 203 | 19.704% |
| Upscale_Quality + FG | 317 | 325 | 2.462% |
| Final Fantasy 14 Dawntrail | 414 | 435.87 | 5.018% |
| Guardian of Galaxy(ULTRA|RT_ULTRA) | 189 | 241 | 21.577% |
| Horizon Zero Dawn Remaster | 189 | 201 | 5.970% |
| Metro Exodus(UTLRA) | 194.93 | 214.5 | 9.124% |
| Rainbow Six Siege(ULTRA|VULKAN) | 597 | 638 | 6.426% |
| Shadow of the Tomb Raide(HIGHEST) | 323 | 371 | 12.938% |
| StarWars Outlaw | |||
| ULTRA | 46 | 58 | 20.690% |
| DLSS_Balanced_FG 2X|DLSS 3 | 172 | N/A | - |
| DLSS_Balanced_FG 4X | N/A | 382 | - |
| Total War:War Hammer 3 | 191.9 | 228.9 | 16.164% |
AI Benchmark - GeForce RTX 5090 vs GeForce RTX 4090
| GeForce RTX 4090 | GeForce RTX 5090 | ||
| Geekbench 6 | |||
| OpenCL | 331418 | 371011 | 10.672% |
| Vulkan | 249353 | 390244 | 36.103% |
| Geekbench AI | |||
| Single Precision | 38968 | 44703 | 12.829% |
| Half Precision | 53304 | 64430 | 17.268% |
| Quantized | 28804 | 32755 | 12.062% |
| Procyon AI image generation | |||
| SD 1.5|INT8 | N/A | N/A | - |
| SD 1.5|FP16 | 3941 | 5168 | 23.742% |
| SDXL|FP16 | 3646 | 5168 | 29.450% |
| Procyon AI image generation beta(FLUX) | (LESS IS BETTER) | ||
| Flux.de(FP8)s/image | 9.508 | 6.61 | -43.843% |
| Flux.dev(FP4)s/image | 17.338 | 3.988 | -334.754% |
| Procyon AI text generation | |||
| Phi-3.5-mini-instruct(Tokens/s) | 248.75 | 316.52 | 21.411% |
| Mistral 7B(Tokens/s) | 182.81 | 261.2 | 30.011% |
| Llama3-8B(Tokens/s) | 151.01 | 217.86 | 30.685% |
| LLama2-13B(Tokens/s) | 93.99 | 136 | 30.890% |
Procyon AI image generation beta(FLUX)中可以見到 GeForce RTX 5090 在 FP4 測試項目中的優勢,與 GeForce RTX 4090 的差距高達 300%。
至於 Procyon AI text generation 部分,除了 Phi-3.5-mini-instruct 只有 21% 的領先外,其餘 3 款模型都有 30% 的差距。
最後要來看看 2 槽設計的 GeForce RTX 5090 Founders Edition 在溫度的表現。
我們是在開放式空間下進行測試,室溫在 26 攝氏度左右,若將 Founders Edition 放置在機殼內,因為機殼內的風扇對流,溫度表現可能會更好一些。
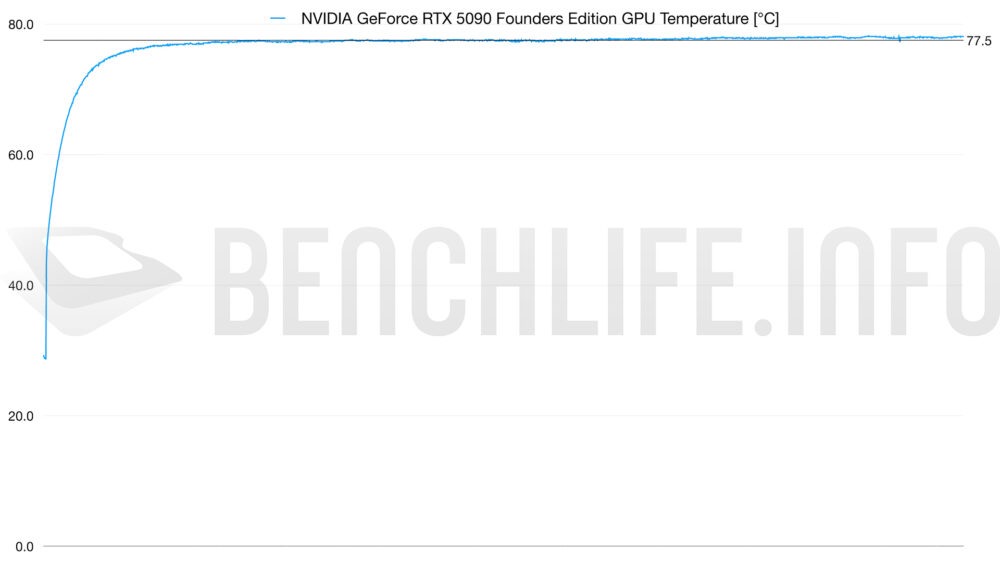
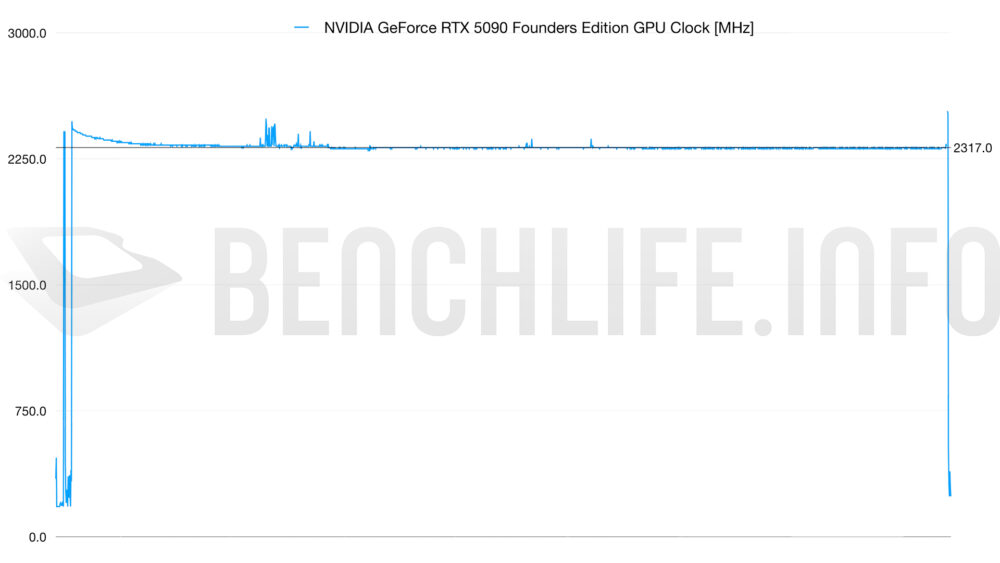
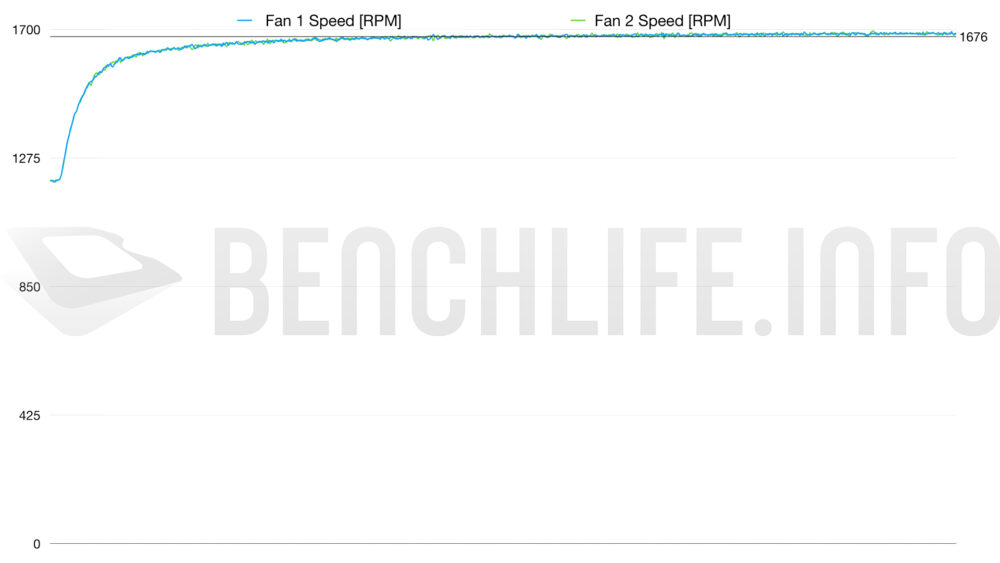
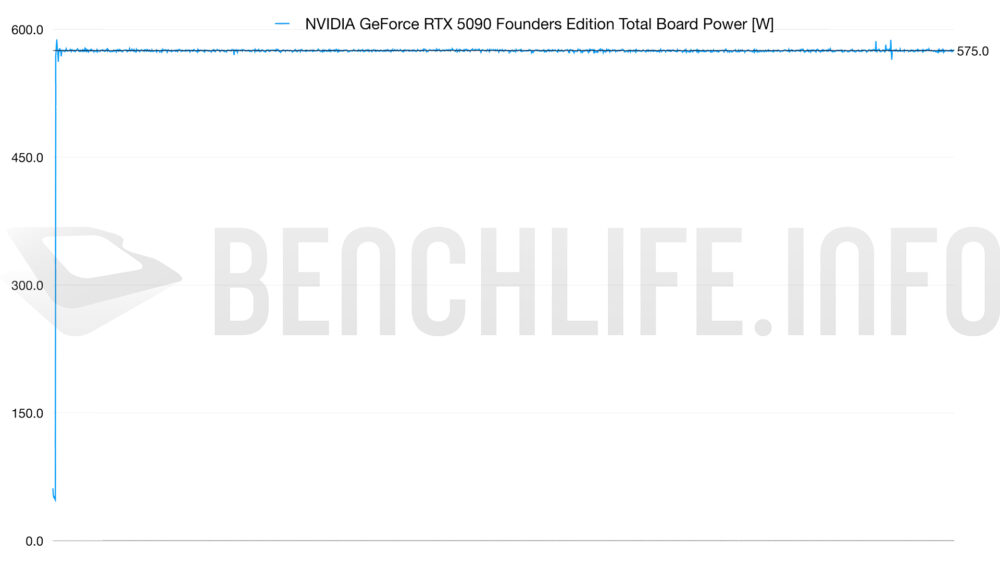
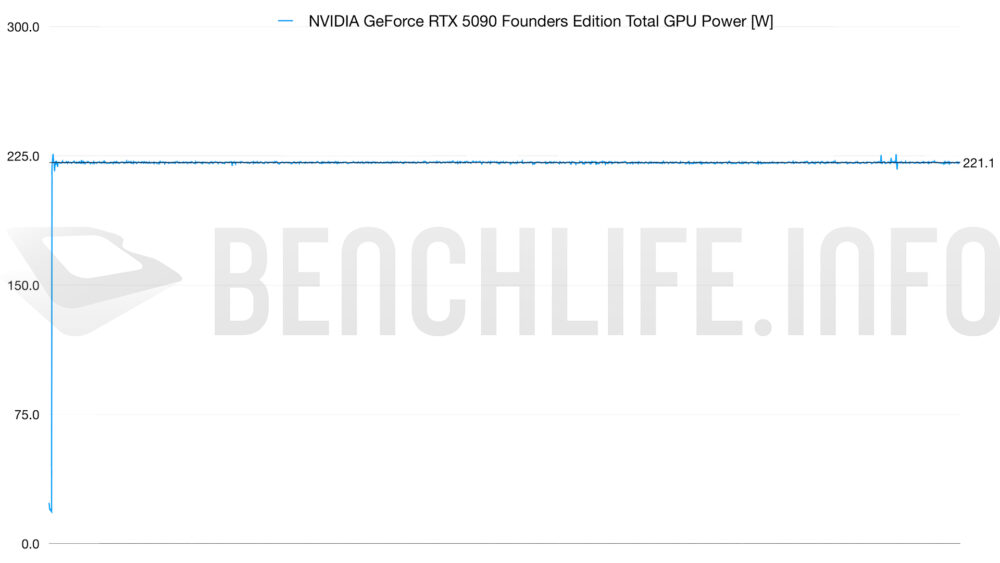
GPU TEMP:77.5 攝氏度;
GPU CLOCK:2317MHz(原數據有誤,1/24 更新);
FAN SPEED:1676 R.P.M;
TGP(Total Graphics Power):575W
Founders Edition 的整卡功耗在 575W(單單 GPU 部分為 221.1W),此時溫度中位數在 77.5 攝氏度,而 GPU 核心時脈維持在 1987MHz;在 Furmark 壓力測試下,2 顆風扇轉速在 1600 R.P.M 左右,但那風扇的聲音基本上是在可以接受的範圍內。
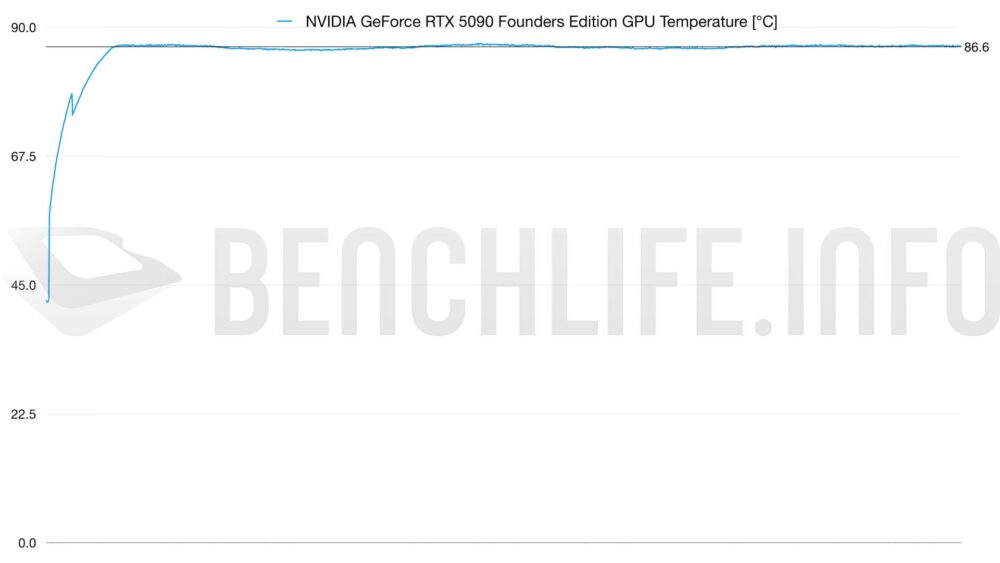
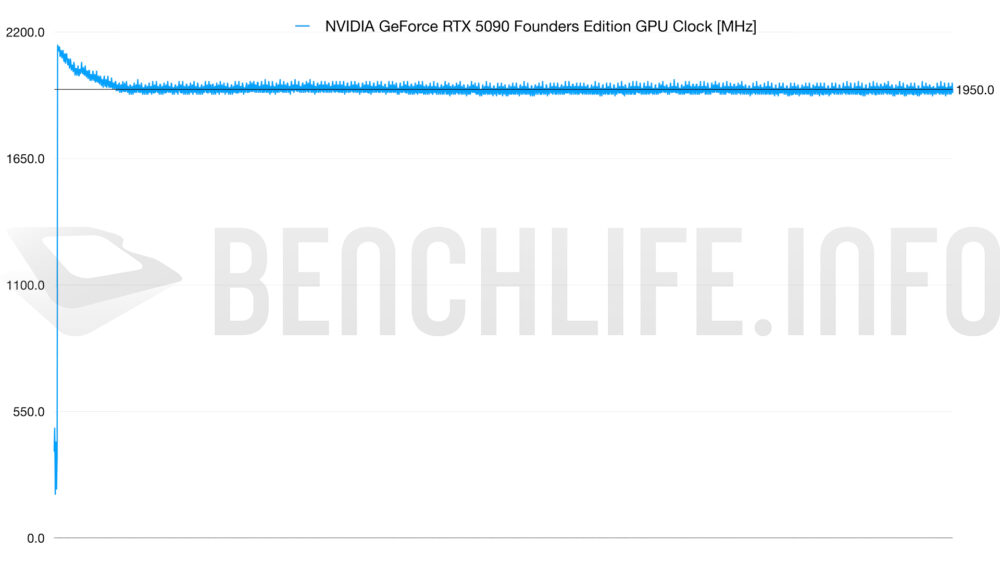
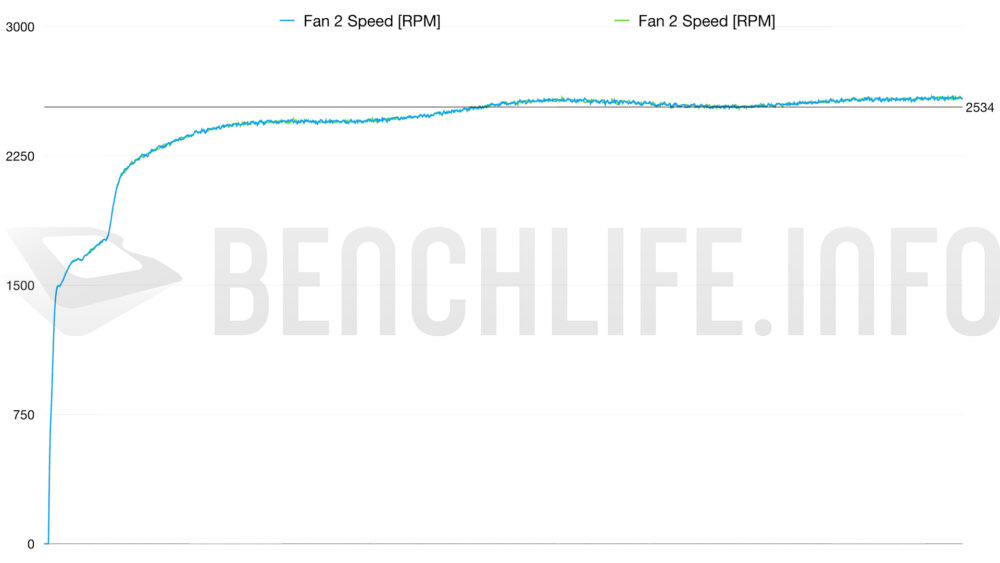
另外,我們也將 GeForce RTX 5090 Founders Edition 放入到恆溫恆濕箱中,在環溫設定在 40 攝氏度的條件下,看看這款顯示卡的溫度表現。
GPU TEMP:86.6 攝氏度;
GPU CLOCK:1950MHz;
FAN SPEED:2534 R.P.M;
切記,恆溫恆濕箱內基本上是沒有任何風流在流動,因此顯示卡溫度高是合理的。類似測試只是想看看 GeForce RTX 5090 Founders Edition 散熱器的能耐,一般機殼在擁有風扇的條件下,是不會達到環溫 40 攝氏度的條件。
就我們過往測試顯示卡的經驗來說,77.5 攝氏度溫度表現,確實是要高許多,然而 GeForce RTX 5090 Founders Edition 是一張整卡功耗達 575W 的 2 槽顯示卡,因此以這樣的溫度表現來說,我們認為是非常合理的可接受範圍。也是因為如此,所以各 AIC 合作夥伴的超過 3 槽設計的顯示卡,讓消費者有不一樣的選擇。
更好的溫度表現、更 Fancy 的外觀設計,以及時尚的 ARGB 燈光效果,這就是 AIC 合作夥伴的產品特色。(嗯… 還有更貴的售價)
畢竟 Founders Edition 本身用意是一種技術展示,品牌定位與行銷大於賺錢,但對於 AIC 合作夥伴來說,就不是如此了。
回到 Blackwell GPU 架構的 GeForce RTX 50 系列上,從 20218 的 GeForce RTX 20 系列開始導入 DLSS(Deep Learning Super Sampling),跟著 2020 年的 DLSS 2、2022 年的 DLSS 3 到 2023 年的 DLSS 3.5,至於新公布的 DLSS 4 則是帶來了 DLSS Multi Frame Generation(多畫格生成)技術。
DLSS 包含 DLSS Multi Frame Generation、DLSS Frame Generation、DLSS Ray Reconstruction、DLSS Super Resolution 以及 DLAA(Deep Learning Anti-Aliasing)等,而這些都需要 GeForce RTX GPU 來實現。
經過那麼多年的努力與推廣,DLSS 目前也有超過 750 款遊戲支援。
當然,現階段 DLSS 4 的遊戲仍舊太少,後續陸續更新之後,應該能讓使用者感受到 DLSS Multi Frame Generation 帶來的優勢。
回到一個問題,有沒有必要從 GeForce RTX 4090 更換至 GeForce RTX 5090。實際上,我們認為這樣的問題應該不存在於部分 GeForce RTX 4090 的使用者,因為選擇 GeForce RTX 4090 就是為了最頂級的硬體,所以現在 GeForce RTX 5090 推出的前提下,在條件允許的情況下,勢必會更換至最新的電腦硬體才對。
如果… Blackwell GPU 架構後面還會有 GeForce RTX 5080、GeForce RTX 5070 Ti 以及 GeForce RTX 5070 等等,預算不足的話,還有其他潛在選項可以讓你選擇。
採用 Blackwell GPU 架構的 NVIDIA GeForce RTX 5090 Founders Edition 效能沒有什麼好質疑的,如果與目前其他已經曝光的 AIC 合作夥伴的 GeForce RTX 5090 顯示卡相比較的話,溫度可能是唯一一個讓人不悅的地方,只是在 2 槽設計,且全金屬外殼的前提之下,Founders Edition 絕對是大部分電腦硬體玩家在 2025 年想要入手的一款產品。(價格?看看其他 AIC 合作夥伴的版本再說吧…)
最後,我們認為集合設計與技術的 NVIDIA GeForce RTX 5090 Founders Edition 顯示卡,有著 Silver 推薦的絕對資格。
