
應該是整個 GeForce RTX 4070 系列顯示卡測試的最後一張(應該…
從 Founders Edition、Dual、WindForce OC、Gaming X Trio 到這次的 TUF Gaming GeForce RTX 4070,共計有 5 款 GeForce RTX 4070 顯示卡測試出現在我們網站上。
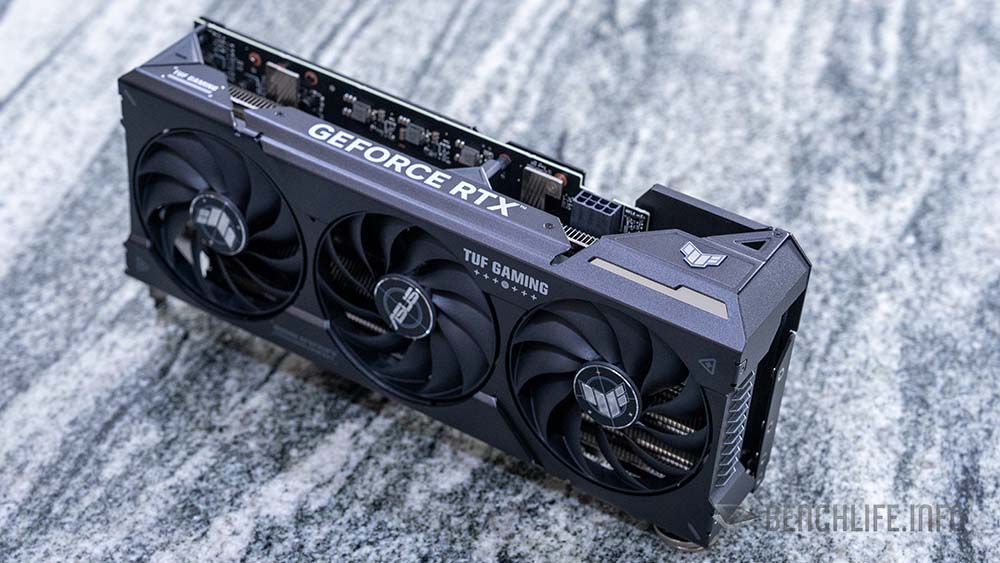
TUF Gaming GeForce RTX 4070 也是一款採用 3 風扇散熱設計(301 x 139 x 63mm),3.15 槽的顯示卡。
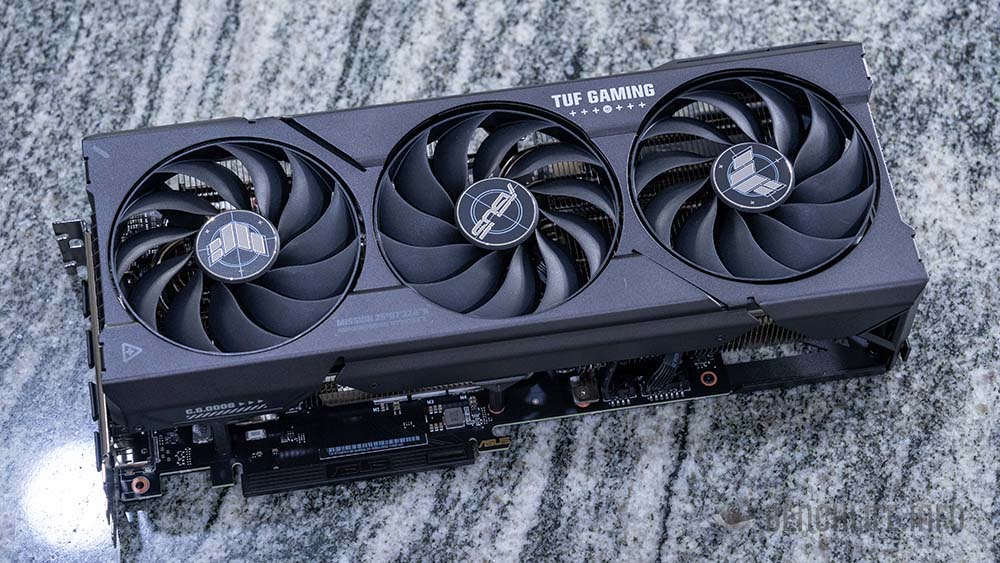
相較於 GIGABYTE GeForce RTX 4070 WindForce OC 的小,與 MSI GeForce RTX 4070 Gaming X Trio 的大,ASUS TUF Gaming GeForce RTX 4070 的 3 風扇散熱器設計讓我們覺得「剛剛」好。
與 Dual GeForce RTX 4070 相同,3.25 槽的 TUF Gaming GeForce RTX 4070 散熱器也採用 Axial—Tech 風扇,同時也導入 Dual Ball Bearing 軸承;相較於 Sleeve 來說,Dual Ball Bearing 可以提供更長的壽命。
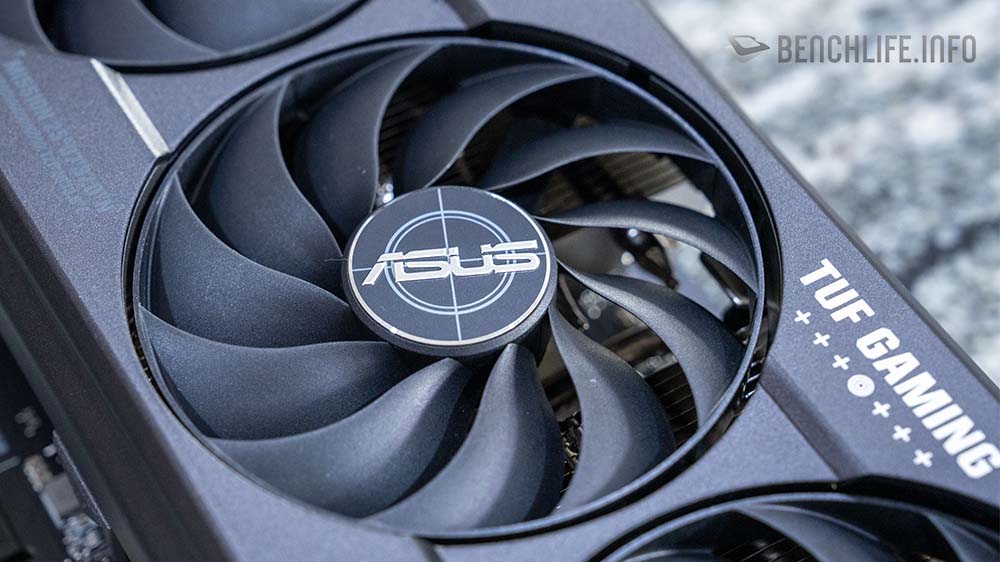
另一方面,這款顯示卡擁有 0dB 功能,也就是說顯示卡風扇在 50°C 以下將不會轉動,風扇轉動溫度設定在 55°C。
同時,TUF Gaming GeForce RTX 4070 風扇也是正逆轉設定。
搭配上 Axial-Tech 風扇與正逆轉與 0dBA 功能,TUF Gaming GeForce RTX 4070 顯示卡散熱器採用 6 根 8mm 熱導管設計,至於散熱表現如何,繼續往下看就能夠了解。
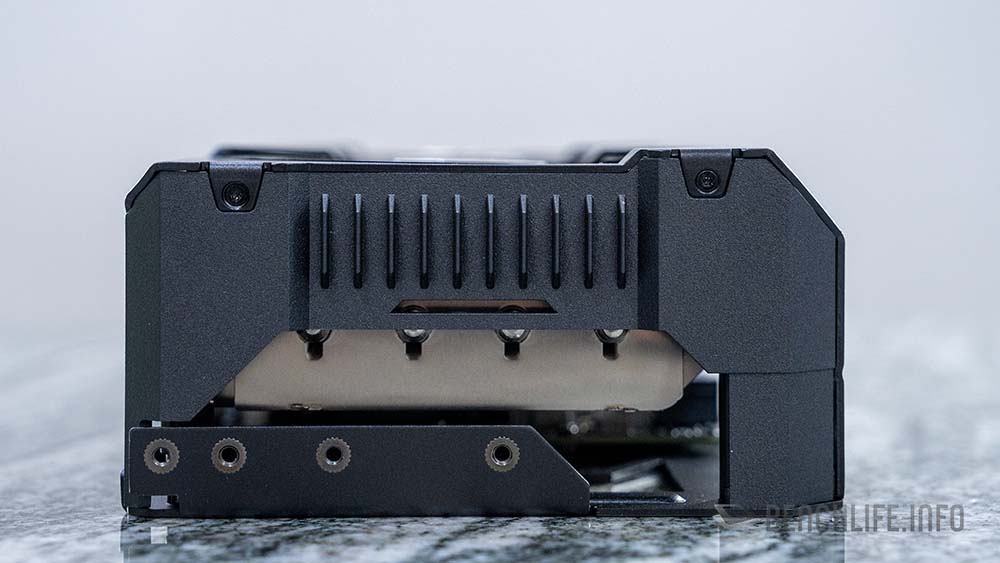
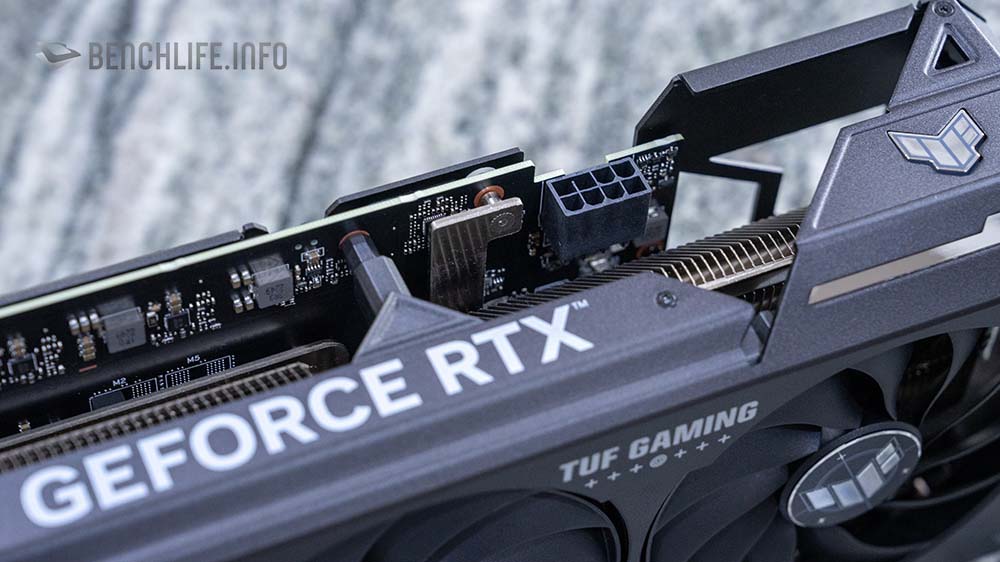
雖然是非 MSRP 的 GeForce RTX 4070,但是 TUF Gaming GeForce RTX 4070 顯示卡採用單 PCIe 8 PIN 供電設計,使用者可以不用擔心轉接線或者是沒有 12VHPWR 電源供應器而煩惱。
當然,TUF Gaming GeForce RTX 4070 顯示卡也有 AURS Sync 的 ARGB 燈光效果。
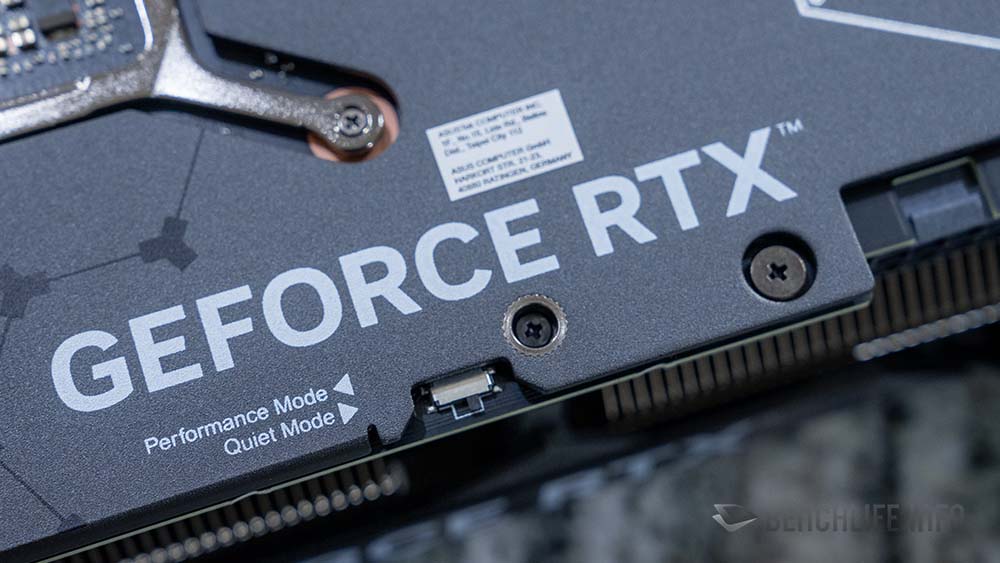
Dual GeForce RTX 4070 擁有 Performance Mode 與 Quiet Mode 2 個 vBIOS 外,TUF Gaming GeForce RTX 4070 當然也不能少。
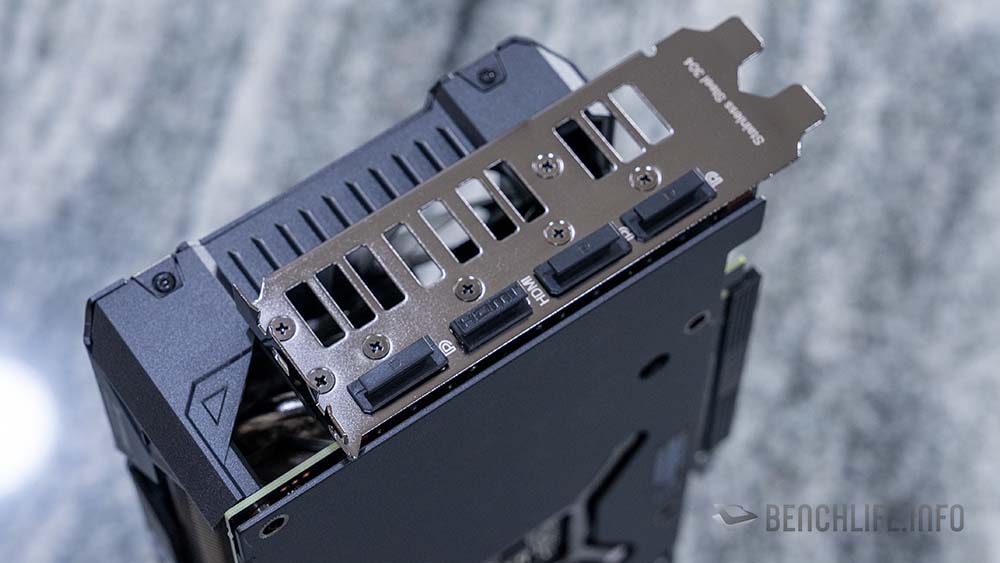
304 Stainless Steel 的 Bracket 當然也能在 TUF Gaming GeForce RTX 4070 上見到,而這款顯示卡的輸出配置為 DP|HDMI|DP|DP 配置,與 Dual GeForce RTX 4070 相同,但與 Founders Edition 的 DP|DP|DP|HDMI 有所不同。
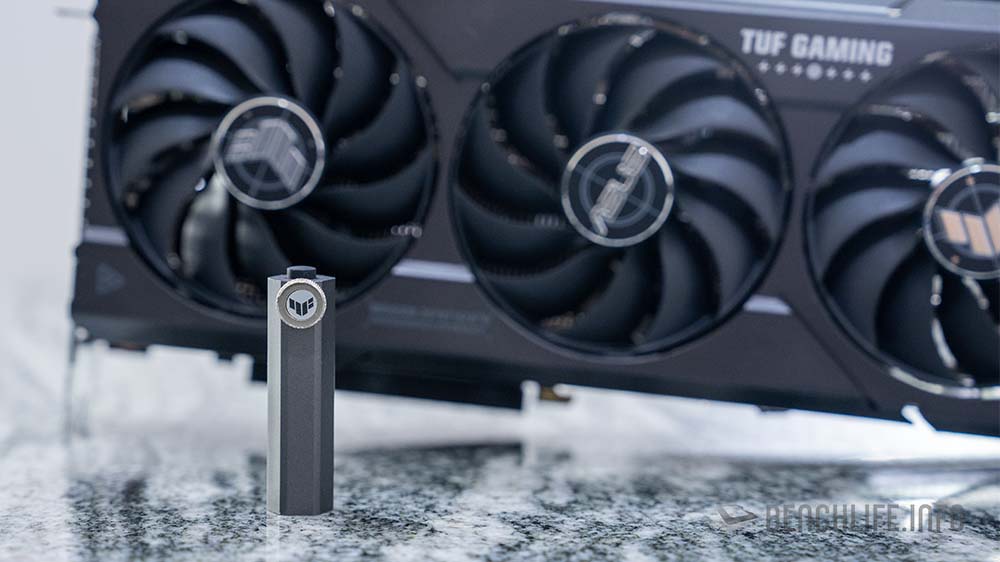
ASUS TUF Gaming GeForce RTX 4070 也有附贈一組擁有螺絲起子功能的顯示卡支撐架。
接下來就是看看 ASUS TUF Gamign GeForce RTX 4070 的效能表現,但不同的是,這次我們使用 GeForce RTX 3080 Founders Edition 與之進行比較。
測試平台
CPU – Intel Core i9-13900K
Motherboard – MSI MEG Z790 GodLike
RAM – G.SKILL Trident Z5 DDR5 6000MT/s 16GB x2
3DMark – NVIDIA GeForce RTX 3080 Founders Edition
| 3DMark | GeForce RTX 3080 Founders Edition | ASUS TUF Gaming GeForce RTX 4070 | |
|---|---|---|---|
| TIme Spy | 18419 | 18986 | 2.986% |
| Graphic score | 17754 | 18365 | 3.327% |
| CPU score | 23388 | 23488 | 0.426% |
| Time Spy Extreme | 9311 | 9285 | -0.280% |
| Graphic score | 8808 | 8781 | -0.307% |
| CPU score | 13779 | 13775 | -0.029% |
| Fire Strike | 38038 | 38815 | 2.002% |
| Graphic score | 43636 | 44839 | 2.683% |
| Physics score | 56138 | 55790 | -0.624% |
| Combo score | 15553 | 15754 | 1.276% |
| Fire Strike Extreme | 21748 | 21703 | -0.207% |
| Graphic score | 21670 | 21846 | 0.806% |
| Physics score | 56020 | 56064 | 0.078% |
| Combo score | 11503 | 11028 | -4.307% |
| Fire Strike Ultra | 11436 | 10720 | -6.679% |
| Graphic score | 11028 | 10305 | -7.016% |
| Physics score | 56044 | 56070 | 0.046% |
| Combo score | 5968 | 5611 | -6.363% |
| Port Royal | 11629 | 11445 | -1.608% |
| Ray Tracing | 48.05 | 52.93 | 9.220% |
| Speed Way | 4647 | 4533 | -2.515% |
| DLSS Feature test | |||
| native | 25.25 | 23.51 | -7.401% |
| DLSS2 | 65.59 | - | - |
| DLSS 3 | - | 87.09 | - |
1440p Gaming – NVIDIA GeForce RTX 3080 Founders Edition
| 1440p | GeForce RTX 3080 Founders Edition | ASUS TUF Gaming GeForce RTX 4070 | |
|---|---|---|---|
| Cyberpunk2077 | 88.08 | 83.83 | -5.070% |
| Cyberpunk2077(RT) | 40.47 | 40.19 | -0.697% |
| Cyberpunk2077(DLSS 3 / DLSS / RSR Quality) | 67.77 | 107.9 | 37.192% |
| F1 22(Ultra) | 79 | 76 | -3.947% |
| F1 22(DLSS 3 / DLSS / FSR) | 110 | 154 | 28.571% |
| Hitman 3 | 196.2 | 191.27 | -2.578% |
| Hitman 3(RT) | 50.69 | 55.5 | 8.667% |
| Hitman 3(DLSS 3 / DLSS / FSR) | 85.64 | 122.19 | 29.912% |
| Portal RTX | 23 | 27.4 | 16.058% |
| Portal RTX(DLSS 3 / DLSS ) | 48.6 | 85.4 | 43.091% |
| Horizon Zero Dawn | 147 | 143 | -2.797% |
| Shadow of the Tomb Raider | 158 | 166 | 4.819% |
| Tom Clancy's Rainbow Six Siege | 503 | 519 | 3.083% |
| Borderlands 3 | 108.4 | 109.85 | 1.320% |
| Total Wars Three Kingdom | 96.7 | 93.1 | -3.867% |
| Metro Exodus | 106.86 | 104.76 | -2.005% |
1080p Gaming – NVIDIA GeForce RTX 3080 Founders Edition
| 1080p | GeForce RTX 3080 Founders Edition | ASUS TUF Gaming GeForce RTX 4070 | |
|---|---|---|---|
| Cyberpunk2077 | 131.56 | 132.13 | 0.431% |
| Cyberpunk2077(RT) | 61.77 | 64.6 | 4.381% |
| Cyberpunk2077(DLSS 3 / DLSS / RSR Quality) | 96.07 | 171.1 | 43.852% |
| F1 22(Ultra) | 113 | 111 | -1.802% |
| F1 22(DLSS 3 / DLSS / FSR) | 149 | 211 | 29.384% |
| Hitman 3 | 285.49 | 284.99 | -0.175% |
| Hitman 3(RT) | 83.87 | 83.91 | 0.048% |
| Hitman 3(DLSS 3 / DLSS / FSR) | 117.11 | 174.89 | 33.038% |
| Portal RTX | 41.5 | 47.9 | 13.361% |
| Portal RTX(DLSS 3 / DLSS ) | 79.3 | 136.6 | 41.947% |
| Horizon Zero Dawn | 178 | 184 | 3.261% |
| Shadow of the Tomb Raider | 220 | 243 | 9.465% |
| Tom Clancy's Rainbow Six Siege | 654 | 699 | 6.438% |
| Borderlands 3 | 150.34 | 157.3 | 4.425% |
| Total Wars Three Kingdom | 149.38 | 147.4 | -1.343% |
| Metro Exodus | 131.3 | 130.79 | -0.390% |
Creator – NVIDIA GeForce RTX 3080 Founders Edition
| Creator | GeForce RTX 3080 Founders Edition | ASUS TUF Gaming GeForce RTX 4070 | |
|---|---|---|---|
| Blender | |||
| Monster | 2549 | 3134 | 18.666% |
| Junk Store | 1579 | 1532 | -3.068% |
| classroom | 1342 | 1536 | 12.630% |
| Vray | |||
| GPU | 2440 | 2695 | 9.462% |
| Pugetbench DaviniCi | |||
| Extended Overall | 2085 | 2185 | 4.577% |
| Standard Overall | 2260 | 2370 | 4.641% |
| 4K Media Score | 178 | 175 | -1.714% |
| 8K Media | 156 | 163 | 4.294% |
| GPU Effects Score | 143 | 129 | -10.853% |
| Fusion Score | 357 | 407 | 12.285% |
| Pugetbench Premiere Pro | |||
| Extended overall score | 1113 | 1081 | -2.960% |
| Standard overall score | 1193 | 1193 | 0.000% |
| Extended export score | 129.6 | 122.7 | -5.623% |
| Extended live playback | 84.8 | 88 | 3.636% |
| Standar Export Score | 136.4 | 137.1 | 0.511% |
| Standar Live Playback Score | 101.9 | 107.3 | 5.033% |
| Effects Score | 119.5 | 113.6 | -5.194% |
| GPU score | 109.9 | 103.5 | -6.184% |
| Stable Diffusion | |||
| 768x768 batch cout 10(it/s) | 4.19 | 4.21 | 0.475% |
| Omniverse Create Viewport(DLSS 3 / DLSS) | |||
| 2K / DLSS Quality | |||
| Campfire(FPS) | 21.16 | 43.23 | 51.053% |
| Flowers4(FPS) | 20.04 | 38.88 | 48.457% |
| incense (FPS) | 7.02 | 43.48 | 83.855% |
| Jade Tiger (FPS) | 15.8 | 32.14 | 50.840% |
| Warehouse(FPS) | 6.82 | 24.48 | 72.141% |
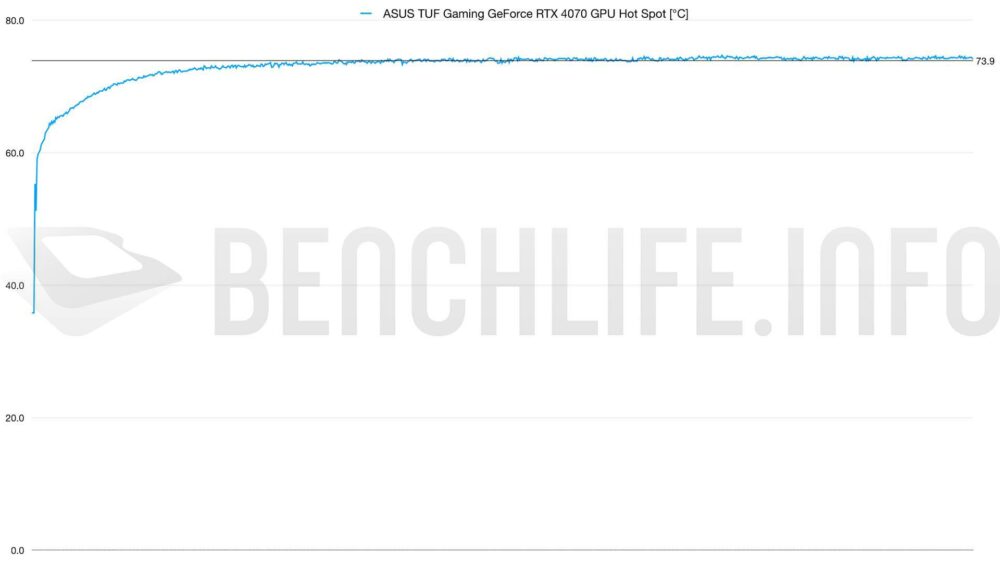
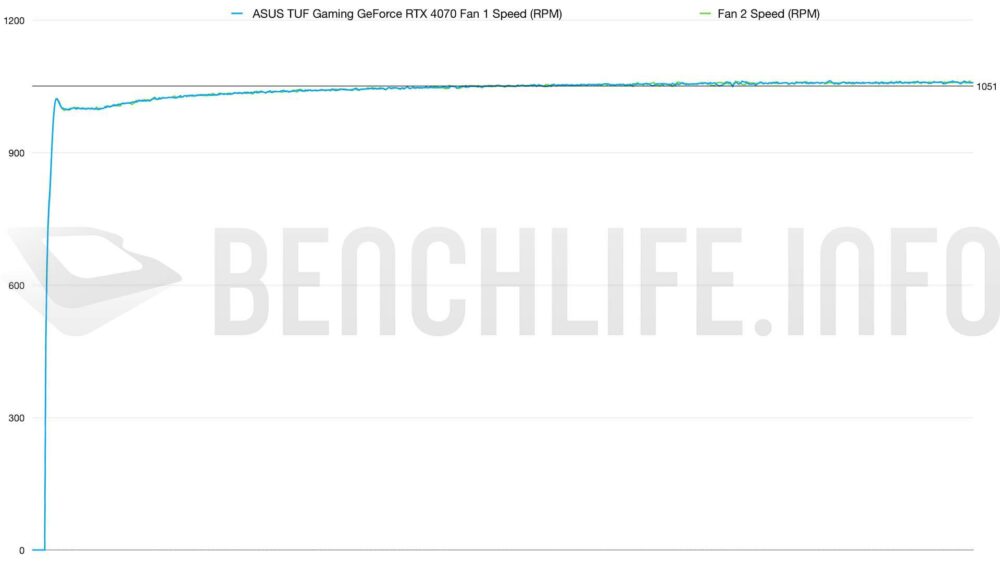
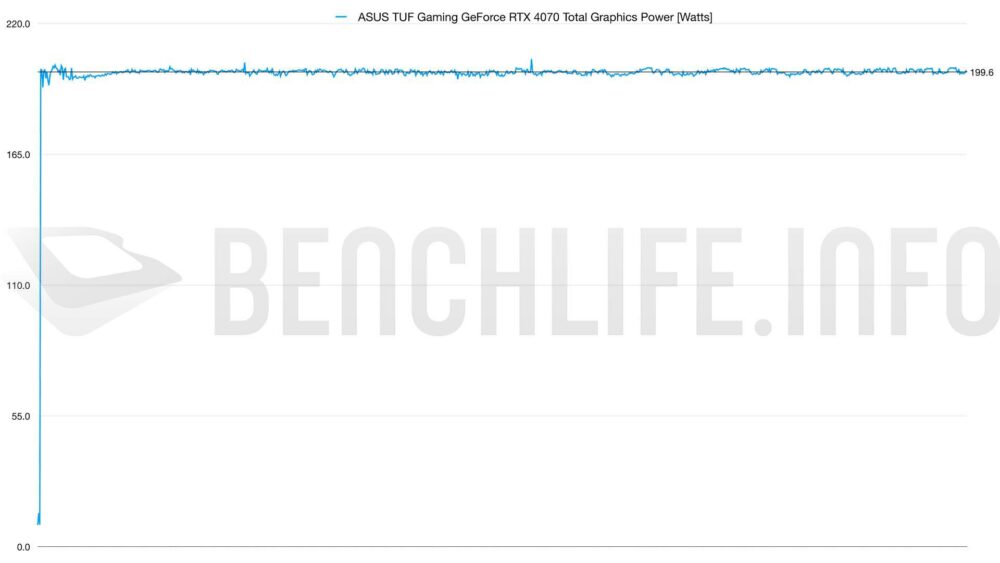
溫度表現方面,我們先來看看 Quiet Mode 的 ASUS TUF Gaming GeForce RTX 4070,在風扇轉速維持在 1051 R.P.M 條件下,GPU 與 Hot Spot 溫度分別是 61.4°C 與 73.9°C,而此時候的 TGP 為 199.6W。
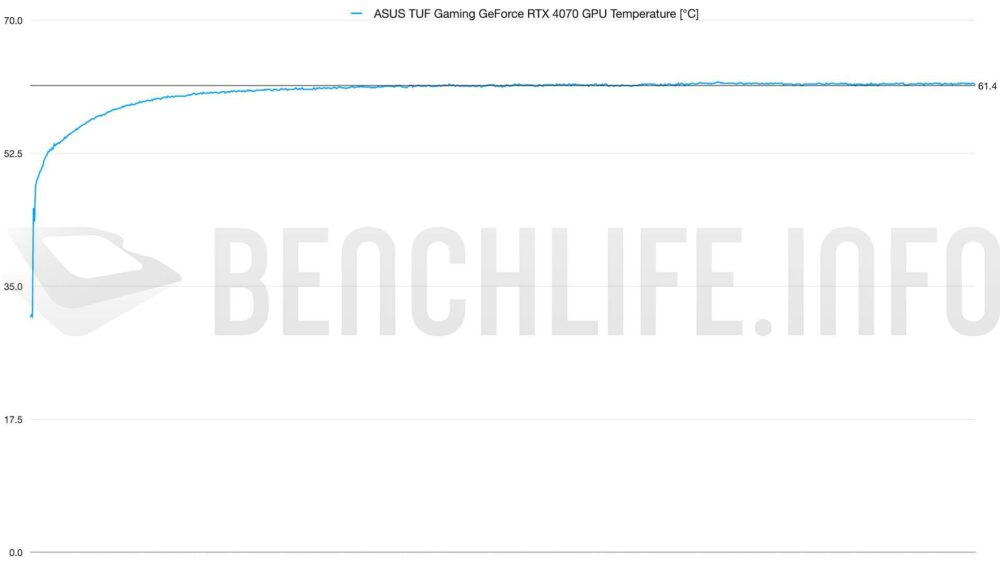
與 2 槽設計的 NVIDIA GeForce RTX 4070 Founders Edition 相比較的話:
GPU TEMP – 64.4 vs 61.4,Δ 3.0°C;
GPU Hot Spot – 76.8 vs 73.9,Δ 2.9°C;
FANS – 1614 vs 1051,Δ 563 R.P.M;
TGP – 191.2 vs 199.6,Δ 8.4W;
前面提到 TUF Gaming 是一款擁有 Quiet Mode 與 Performance Mode 雙 vBIOS 的 GeForce RTX 4070,接下來我們來看看 Performance Mode 的表現。
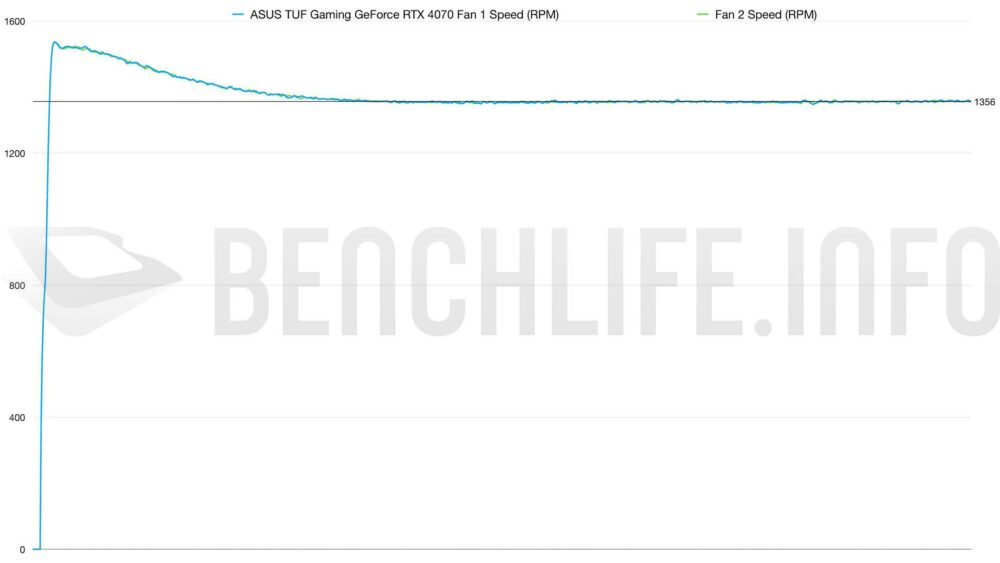
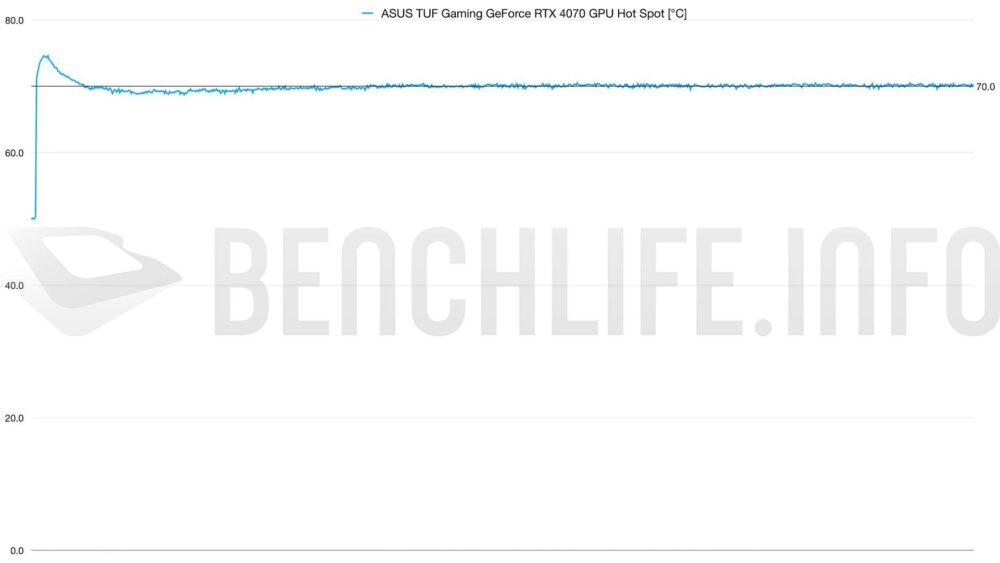
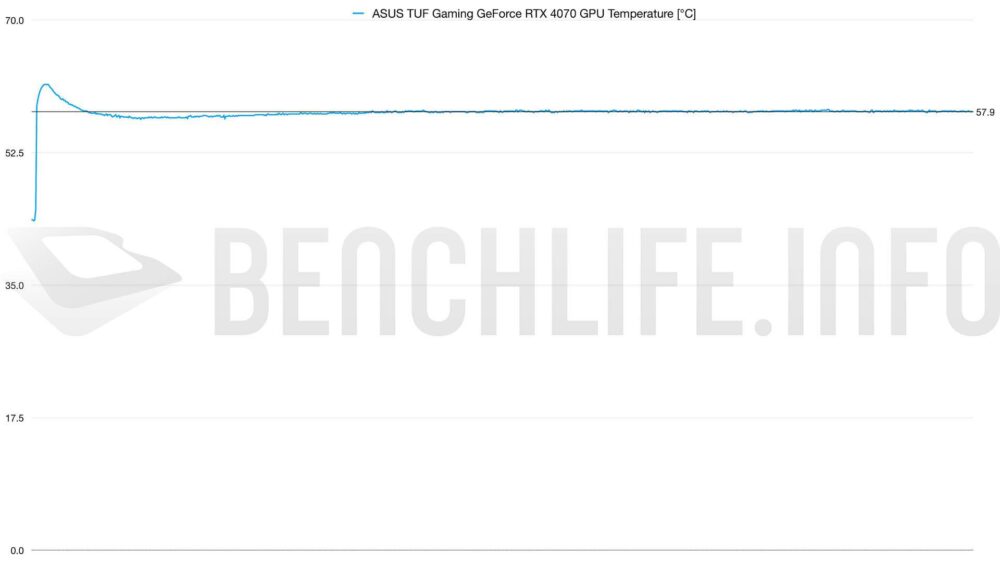
Performance Mode 條件下,風扇轉速來到 1356 R.P.M,GPU 與 Hot Spot 溫度下降到 57.9°C 和 70.0°C。
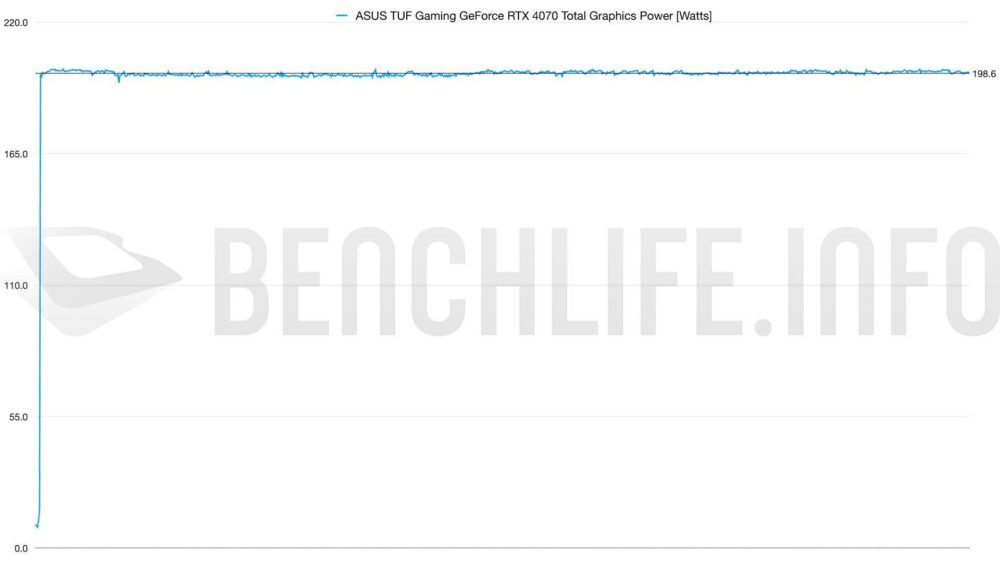
與 Quiet Mode 的 TUF Gaming GeForce RTX 4070 相比較的話:
GPU TEMP – 61.4 vs 57.9,Δ 3.5°C;
GPU Hot Spot – 73.9 vs 70.0,Δ 3.9°C;
FANS – 1051 vs 1356,Δ 305 R.P.M;
TGP – 199.6 vs 198.6,Δ 1W;
Performance vBIOS 明顯讓溫度下降到 57.9°C,雖然風扇轉速來到 1356 R.P.M,但我們裸測條件下,風扇聲音基本上非常小,要貼近才能感受到。
與 GeForce RTX 3080 Founders Edition 相比較的話,TUF Gaming GeForce RTX 4070 的贏面較高,如果是 Ray Tracing 與 DLSS 部分,可以說是 Ada Lovelace 架構的天下。當然,我們也見到 GeForce RTX 3080 在數款遊戲測試中還是領先 GeForce RTX 4070。
NVIDIA GeForce RTX 4070 的 TGP 為 200W,而 GeForce RTX 3080 為 320W,某個程度上可以說 GeForce RTX 4070 表現相當優異。
如果以預設 vBIOS 來看,TUF Gaming GeForce RTX 4070 並不算優異,然而在切換至 Performance vBIOS 後,這張顯示卡的溫度表現發揮了它的水平,如果不在意風扇轉速偏高的話,我們會建議選擇 Performance vBIOS 的設定執行這張顯示卡。
外觀設計部分與 TUF Gaming GeForce RTX 4070 Ti 相同,就不用多介紹。
如果只想挑選 ASUS 的 GeForce RTX 4070,Dual 跟 TUF Gaming 都是不錯的選擇,就看你的機殼想要 2.5 槽、雙風扇設計的 Dual,還是 3.25 槽、3 風扇設計的 TUF Gaming 了。
NVIDIA GeForce RTX 4070 實測
- 1. NVIDIA GeForce RTX 4070 Founders Edition
2. ASUS Dual GeForce RTX 4070
3. GIGABYTE GeForce RTX 4070 WindForce OC
4. MSI GeForce RTX 4070 Gaming X Trio
5. ASUS TUF Gaming GeForce RTX 4070