未來又多了一個可以測試顯示卡的項目。
UL 推出的 Procyon Benchmark 在近期更新,這次更新主要是加入 AI Image Generation Benchmark。

新推出的 UL Procyon AI Image Generation Benchmark 是為了更好地衡量中階、中高階與高階獨立顯示卡的效能而推出,它包含 2 個測試項目,分別是 Stable Diffusion XL(FP16)與 Stable Diffusion 1.5(FP16)。
Stable Diffusion XL(FP16)與 Stable Diffusion 1.5(FP16)測試項目提供 3 中 AI Inference Engine 進行測試,這包含 TensorRT、Intel OpenVINO 與 ONNX Runtime。
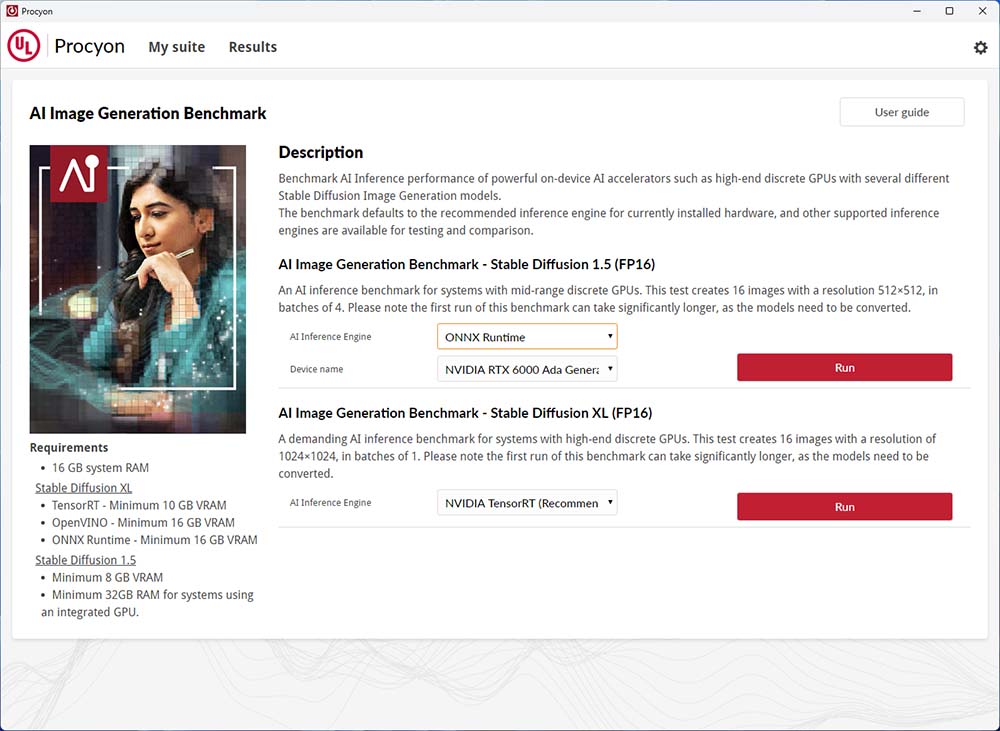
在 Stable Diffusion XL(FP16)中,TensorRT 最低需要 10GB VRAM,OpenVINO 需要 16GB VRAM,至於 ONNX Runtime 最低則是 16GB VRAM;至於針對中高階顯示卡的 Stable Diffusion 1.5(FP16)最低則需要 8GB VRAM。
我們選擇了以下顯示卡進行測試:
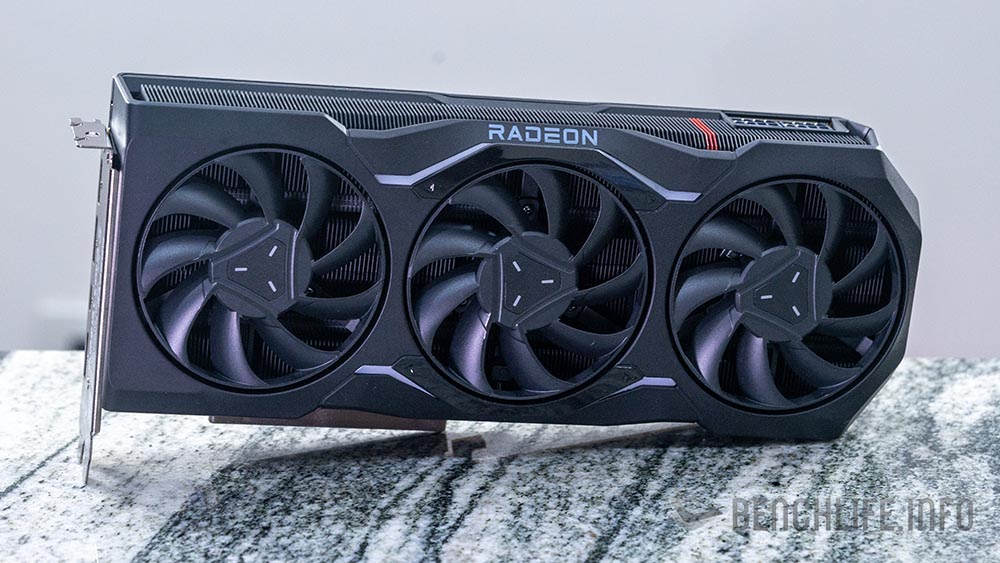
AMD
– Radeon RX 7900 XTX 24GB MBA
– Radeon RX 7900 XT 20GB MBA
– Sapphire Radeon RX 7900 GRE 20GB Nitro+
– Radeon RX 7800 XT 16GB MBA
– Radeon RX 7700 XT 12GB Pulse
Intel
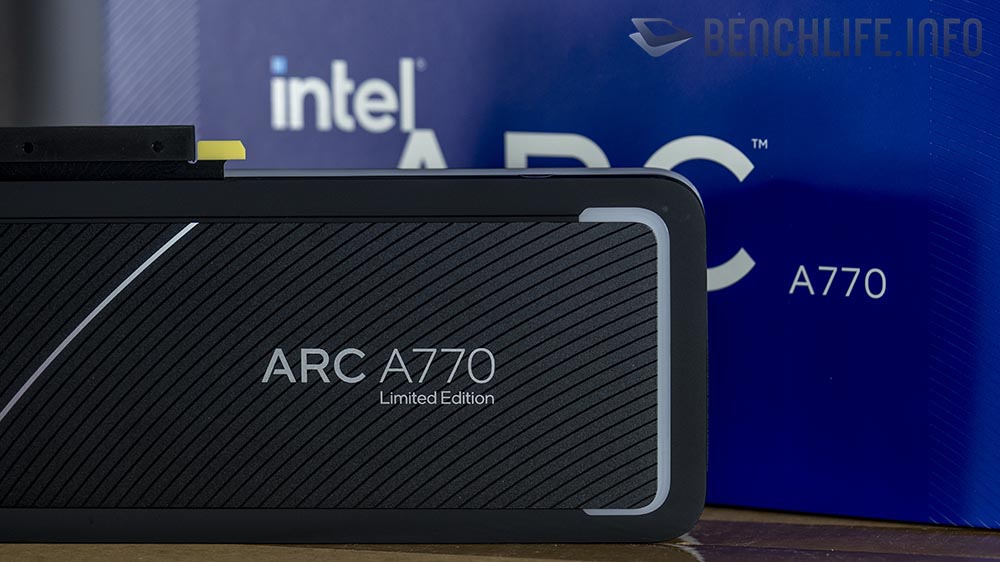
– Intel Arc A770 16GB Limited Edition
NVIDIA
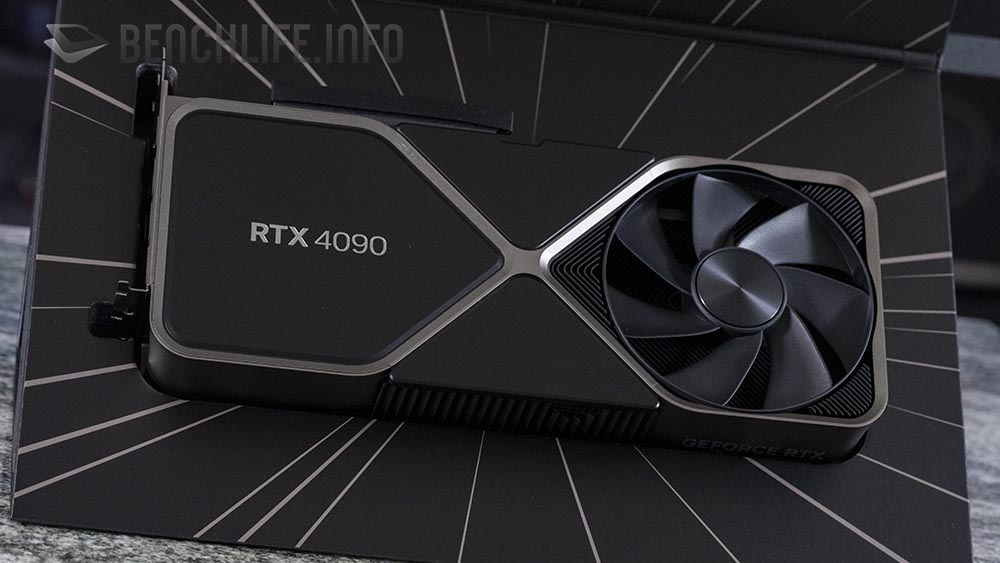
– GeForce RTX 4090 24GB Founders Edition
– GeForce RTX 4080 16GB Founders Edition
– TUF Gaming GeForce RTX 4070 Ti 16GB
– GeForce RTX 4070 12GB Founders Edition
測試部分先看看 TensorRT 這個 AI Inference Engine 的數據,這部分就只有 NVIDIA GeForce 顯示卡能夠執行。
| Overall Time (sec) | Image Generation Speeds (Image / sec) | Score | |
|---|---|---|---|
| Stable Diffusion XL(FP16) | |||
| GeForce RTX 4090 | 126.417 | 7.901 | 4746 |
| GeForce RTX 4080 | 193.202 | 12.075 | 3105 |
| GeForce RTX 4070 Ti | 234.969 | 14.686 | 2553 |
| GeForce RTX 4070 | 346.408 | 21.651 | 1732 |
| Stable Diffusion 1.5(FP16) | |||
| GeForce RTX 4090 | 18.413 | 1.151 | 5430 |
| GeForce RTX 4080 | 28.457 | 1.779 | 3514 |
| GeForce RTX 4070 Ti | 37.859 | 2.365 | 2641 |
| GeForce RTX 4070 | 50.507 | 3.157 | 1979 |
跟著就是 Intel OpenVINO 部分,但因為 Stable Diffusion XL(FP16)最低要求為 16GB,因此我們沒有將 8GB 的 Intel Arc A750 與 Intel Arc A580 加入測試。
| Overall Time (sec) | Image Generation Speeds (Image / sec) | Score | |
|---|---|---|---|
| Stable Diffusion XL(FP16) | |||
| Intel Arc A770 | 817.794 | 51.112 | 733 |
| Stable Diffusion 1.5(FP16) | |||
| Intel Arc A770 | 144.908 | 9.057 | 690 |
最後是 ONNX Runtim AI Inference Engine 的測試數據。
| Overall Time (sec) | Image Generation Speeds (Image / sec) | Score | |
|---|---|---|---|
| Stable Diffusion XL(FP16) | |||
| GeForce RTX 4090 | 172.309 | 10.769 | 3482 |
| GeForce RTX 4080 | 264.619 | 16.539 | 2267 |
| GeForce RTX 4070 Ti | 330.064 | 20.629 | 1817 |
| Radeon RX 7900 XTX | 382.361 | 23.898 | 1569 |
| GeForce RTX 4070 | 431.601 | 26.975 | 1390 |
| Radeon RX 7900 XT | 439.651 | 27.478 | 1364 |
| Radeon RX 7900 GRE | 479.453 | 29.966 | 1251 |
| Radeon RX 7800 XT | 628.809 | 39.301 | 954 |
| Radeon RX 7700 XT | 665.666 | 41.604 | 901 |
| Intel Arc A770 | 2755.363 | 172.21 | 217 |
| Stable Diffusion 1.5(FP16) | |||
| GeForce RTX 4090 | 27.35 | 1.709 | 3656 |
| GeForce RTX 4080 | 40.59 | 2.537 | 2463 |
| GeForce RTX 4070 Ti | 50.476 | 3.155 | 1981 |
| Radeon RX 7900 XTX | 51.715 | 3.232 | 1933 |
| Radeon RX 7900 XT | 59.913 | 3.745 | 1669 |
| GeForce RTX 4070 Ti | 65.879 | 4.117 | 1517 |
| Radeon RX 7900 GRE | 67.319 | 4.207 | 1485 |
| Radeon RX 7800 XT | 82.508 | 5.157 | 1211 |
| Radeon RX 7700 XT | 90.829 | 5.677 | 1100 |
| Intel Arc A770 | 351.159 | 21.947 | 284 |
Intel Arc 在 UL Procyon AI Benchmark 的表現實在不怎樣,如果用「不入流」來形容它,應該不太好,但 Intel Arc A770 在測試所需要的時間最久,若想要使用 Intel Arc A770 執行 Stable Diffusion 可能要好好思考一下。
至於 Intel 會不會在未來的驅動程式強化,就讓我們繼續觀望吧。
整體來說,Ada Lovelace GPU 架構的 GeForce RTX 40 系列表現依舊優異,在 TensorRT AI Inference Engine 方面,更能輕易看到其優勢。