這次測試平台使用的是 AMD Ryzen 9 7900X,搭配 ROG Crosshair X670E Hero 主機板與 DDR5-6000 MT/s 記憶體。
3DMark – AMD Radeon RX 7900 XT;
| 3DMark | Radeon RX 7900 XT | GeForce RTX 4070 Ti | |
| TIme Spy | 22944 | 21334 | -7.547% |
| Graphic score | 25074 | 22994 | -9.046% |
| CPU score | 15489 | 15143 | -2.285% |
| | | |
| Time Spy Extreme | 11845 | 10920 | -8.471% |
| Graphic score | 12203 | 11082 | -10.116% |
| CPU score | 10160 | 10089 | -0.704% |
| | | |
| Fire Strike | 48233 | 41389 | -16.536% |
| Graphic score | 68377 | 51078 | -33.868% |
| Physics score | 41969 | 40873 | -2.681% |
| Combo score | 16214 | 17219 | 5.837% |
| | | |
| Fire Strike Extreme | 30778 | 26078 | -18.023% |
| Graphic score | 33458 | 27174 | -23.125% |
| Physics score | 41586 | 41781 | 0.467% |
| Combo score | 15462 | 13974 | -10.648% |
| | | |
| Fire Strike Ultra | 16846 | 13794 | -22.126% |
| Graphic score | 16887 | 13530 | -24.812% |
| Physics score | 41542 | 41996 | 1.081% |
| Combo score | 8822 | 7413 | -19.007% |
| | | |
| Port Royal | 13263 | 14248 | 6.913% |
| | | |
| Ray Tracing | 40.96 | 68.19 | 39.933% |
| | | |
| Speed Way | 4857 | 5464 | 11.109% |
3DMark – GIGABYTE GeForce RTX 4080 Gaming OC;
| 3DMark | GeForce RTX 4080 | GeForce RTX 4070 Ti | |
| TIme Spy | 25291 | 21334 | -18.548% |
| Graphic score | 27958 | 22994 | -21.588% |
| CPU score | 16418 | 15143 | -8.420% |
| | | |
| Time Spy Extreme | 13167 | 10920 | -20.577% |
| Graphic score | 13921 | 11082 | -25.618% |
| CPU score | 10078 | 10089 | 0.109% |
| | | |
| Fire Strike | 45371 | 41389 | -9.621% |
| Graphic score | 61983 | 51078 | -21.350% |
| Physics score | 41245 | 40873 | -0.910% |
| Combo score | 15864 | 17219 | 7.869% |
| | | |
| Fire Strike Extreme | 30856 | 26078 | -18.322% |
| Graphic score | 32663 | 27174 | -20.199% |
| Physics score | 42559 | 41781 | -1.862% |
| Combo score | 16888 | 13974 | -20.853% |
| | | |
| Fire Strike Ultra | 17199 | 13794 | -24.685% |
| Graphic score | 16945 | 13530 | -25.240% |
| Physics score | 42594 | 41996 | -1.424% |
| Combo score | 9653 | 7413 | -30.217% |
| | | |
| Port Royal | 17819 | 14248 | -25.063% |
| | | |
| Ray Tracing | 84.36 | 68.19 | -23.713% |
| | | |
| Speed Way | 7099 | 5464 | -29.923% |
| | | |
| DLSS Feature test | | | |
| native | 38.62
| 29.83 | -29.467% |
| DLSS 3 | 132.71 | 104.96 | -26.439% |
3DMark – GIGABYTE GeForce RTX 3090 Ti Gaming OC;
| 3DMark | GeForce RTX 3090 Ti | GeForce RTX 4070 Ti | |
| TIme Spy | 20601 | 21334 | 3.436% |
| Graphic score | 21812 | 22994 | 5.140% |
| CPU score | 15672 | 15143 | -3.493% |
| | | |
| Time Spy Extreme | 11081 | 10920 | -1.474% |
| Graphic score | 11274 | 11082 | -1.733% |
| CPU score | 10103 | 10089 | -0.139% |
| | | |
| Fire Strike | 40645 | 41389 | 1.798% |
| Graphic score | 49143 | 51078 | 3.788% |
| Physics score | 42652 | 40873 | -4.353% |
| Combo score | 17168 | 17219 | 0.296% |
| | | |
| Fire Strike Extreme | 25428 | 26078 | 2.493% |
| Graphic score | 25867 | 27174 | 4.810% |
| Physics score | 42627 | 41781 | -2.025% |
| Combo score | 14679 | 13974 | -5.045% |
| | | |
| Fire Strike Ultra | 14065 | 13794 | -1.965% |
| Graphic score | 13174 | 13530 | 2.631% |
| Physics score | 42152 | 41996 | -0.371% |
| Combo score | 7783 | 7413 | -4.991% |
| | | |
| Port Royal | 14834 | 14248 | -4.113% |
| | | |
| Ray Tracing | 60.59 | 68.19 | 11.145% |
| | | |
| Speed Way | 5882 | 5464 | -7.650% |
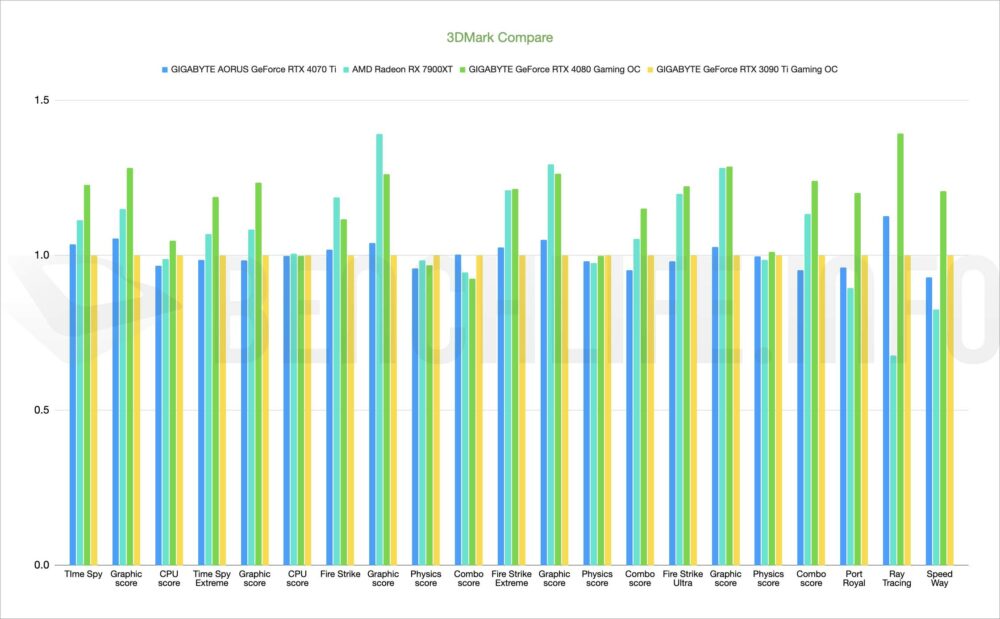
GIGABYTE AORUS GeForce RTX 4070 Ti ELITE 3DMark 比較圖:

跟著我們來看看 4K、1440p 與 1080p 遊戲的表現。
4K Gaming – AMD Radeon RX 7900 XT;
| 4K Gaming | Radeon RX 7900 XT | GeForce RTX 4070 Ti | |
| Assassin Creed Vahalla | 87 | 79 | -10.127% |
| Borderlands 3 : bad ass | 88.51 | 69.87 | -26.678% |
| Cyberpunk2077 | 57.98 | 49.93 | -16.123% |
| Tom Clancy’s The Division 2 | 93 | 92 | -1.087% |
| Metro Exodus | 88.36 | 83.58 | -5.719% |
| Far Cry 6 | 105 | 89 | -17.978% |
| Guardian of Galaxy(ultra) | 110 | 111 | 0.901% |
| Horizon Zero Dawn | 97 | 92 | -5.435% |
| Rainbow Six Siege | 370 | 344 | -7.558% |
| Shadow of the Tomb Raider (highest) | 108 | 103 | -4.854% |
| SpiderMan Miles Moral (Very High) | 80.400000000000006 | 82 | 1.951% |
| Total War: Troy | 116.4 | 93.3 | -24.759% |
| WarHammer Darktide(High) | 55.1 | 48 | -14.792% |
| Watch Dog Legion | 82 | 69 | -18.841% |
4K Gaming – GIGABYTE GeForce RTX 4080 Gaming OC;
| 4K Gaming | GeForce RTX 4080 | GeForce RTX 4070 Ti | |
| Assassin Creed Vahalla | 95 | 79 | -20.253% |
| Borderlands 3 : bad ass | 90.22 | 69.87 | -29.126% |
| Cyberpunk2077 | 64.8 | 49.93 | -29.782% |
| Tom Clancy’s The Division 2 | 115 | 92 | -25.000% |
| Metro Exodus | 104.33 | 83.58 | -24.827% |
| Far Cry 6 | 110 | 89 | -23.596% |
| Guardian of Galaxy(ultra) | 140 | 111 | -26.126% |
| Horizon Zero Dawn | 117 | 92 | -27.174% |
| Rainbow Six Siege | 410 | 344 | -19.186% |
| Shadow of the Tomb Raider (highest) | 134 | 103 | -30.097% |
| SpiderMan Miles Moral (Very High) | 103.4 | 82 | -26.098% |
| Total War: Troy | 118.7 | 93.3 | -27.224% |
| WarHammer Darktide(High) | 65.7 | 48 | -36.875% |
| Watch Dog Legion | 87 | 69 | -26.087% |
4K Gaming – GIGABYTE GeForce RTX 3090 Ti Gaming OC;
| 4K Gaming | GeForce RTX 3090 Ti | GeForce RTX 4070 Ti | |
| Assassin Creed Vahalla | 82 | 79 | -3.797% |
| Borderlands 3 : bad ass | 81.52 | 69.87 | -16.674% |
| Cyberpunk2077 | 57.57 | 49.93 | -15.301% |
| Tom Clancy’s The Division 2 | 99 | 92 | -7.609% |
| Metro Exodus | 87.41 | 83.58 | -4.582% |
| Far Cry 6 | 92 | 89 | -3.371% |
| Guardian of Galaxy(ultra) | 130 | 111 | -17.117% |
| Horizon Zero Dawn | 109 | 92 | -18.478% |
| Rainbow Six Siege | 389 | 344 | -13.081% |
| Shadow of the Tomb Raider (highest) | 111 | 103 | -7.767% |
| SpiderMan Miles Moral (Very High) | 86.8 | 82 | -5.854% |
| Total War: Troy | 106.8 | 93.3 | -14.469% |
| WarHammer Darktide(High) | 46.9 | 48 | 2.292% |
| Watch Dog Legion | 72 | 69 | -4.348% |
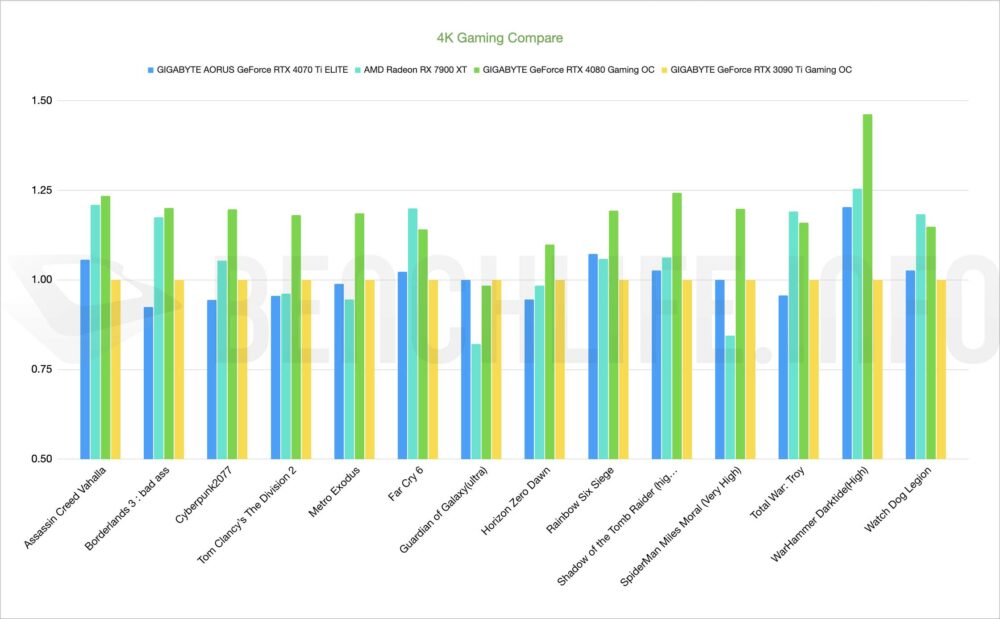
GIGABYTE AORUS GeForce RTX 4070 Ti ELITE 4K Gaming 比較圖:

1440p Gaming – AMD Radeon RX 7900 XT;
| 1440p Gaming | Radeon RX 7900 XT | GeForce RTX 4070 Ti | |
| Assassin Creed Vahalla | 150 | 131 | -14.504% |
| Borderlands 3 : bad ass | 165.23 | 129.99 | -27.110% |
| Cyberpunk2077 | 116.76 | 104.72 | -11.497% |
| Tom Clancy’s The Division 2 | 175 | 174 | -0.575% |
| Metro Exodus | 122.67 | 128.22 | 4.328% |
| Far Cry 6 | 162 | 138 | -17.391% |
| Guardian of Galaxy(ultra) | 152 | 185 | 17.838% |
| Horizon Zero Dawn | 180 | 173 | -4.046% |
| Rainbow Six Siege | 625 | 633 | 1.264% |
| Shadow of the Tomb Raider (highest) | 205 | 198 | -3.535% |
| SpiderMan Miles Moral (Very High) | 111.4 | 132 | 15.606% |
| Total War: Troy | 208.6 | 167.6 | -24.463% |
| WarHammer Darktide(High) | 107.4 | 103 | -4.272% |
| Watch Dog Legion | 136 | 118 | -15.254% |
1440p Gaming – GIGABYTE GeForce RTX 4080 Gaming OC;
| 1440p Gaming | GeForce RTX 4080 | GeForce RTX 4070 Ti | |
| Assassin Creed Vahalla | 153 | 131 | -16.794% |
| Borderlands 3 : bad ass | 168.9 | 129.99 | -29.933% |
| Cyberpunk2077 | 132.69 | 104.72 | -26.709% |
| Tom Clancy’s The Division 2 | 215 | 174 | -23.563% |
| Metro Exodus | 153.8 | 128.22 | -19.950% |
| Far Cry 6 | 154 | 138 | -11.594% |
| Guardian of Galaxy(ultra) | 182 | 185 | 1.622% |
| Horizon Zero Dawn | 201 | 173 | -16.185% |
| Rainbow Six Siege | 704 | 633 | -11.216% |
| Shadow of the Tomb Raider (highest) | 240 | 198 | -21.212% |
| SpiderMan Miles Moral (Very High) | 158 | 132 | -19.697% |
| Total War: Troy | 203.1 | 167.6 | -21.181% |
| WarHammer Darktide(High) | 125.2 | 103 | -21.553% |
| Watch Dog Legion | 132 | 118 | -11.864% |
1440p Gaming – GIGABYTE GeForce RTX 3090 Ti Gaming OC;
| 1440p Gaming | GeForce RTX 3090 Ti | GeForce RTX 4070 Ti | |
| Assassin Creed Vahalla | 124 | 131 | 5.344% |
| Borderlands 3 : bad ass | 140.64
| 129.99 | -8.193% |
| Cyberpunk2077 | 110.86 | 104.72 | -5.863% |
| Tom Clancy’s The Division 2 | 182 | 174 | -4.598% |
| Metro Exodus | 129.7 | 128.22 | -1.154% |
| Far Cry 6 | 135 | 138 | 2.174% |
| Guardian of Galaxy(ultra) | 185 | 185 | 0.000% |
| Horizon Zero Dawn | 183 | 173 | -5.780% |
| Rainbow Six Siege | 590 | 633 | 6.793% |
| Shadow of the Tomb Raider (highest) | 193 | 198 | 2.525% |
| SpiderMan Miles Moral (Very High) | 131.9 | 132 | 0.076% |
| Total War: Troy | 175.2 | 167.6 | -4.535% |
| WarHammer Darktide(High) | 85.6 | 103 | 16.893% |
| Watch Dog Legion | 115 | 118 | 2.542% |
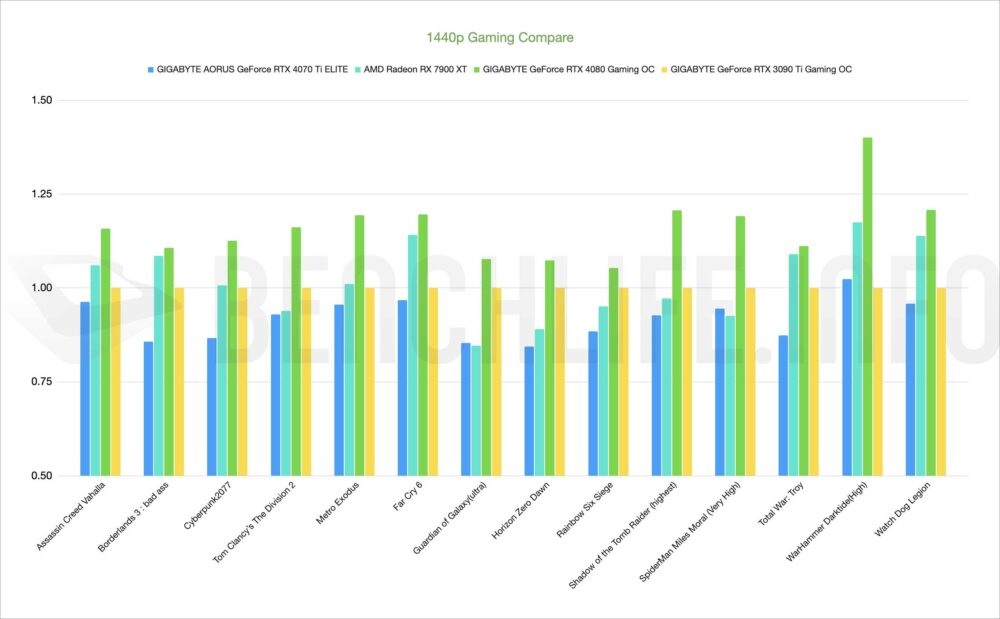
GIGABYTE AORUS GeForce RTX 4070 Ti ELITE 1440p Gaming 比較圖:

1080p Gaming – AMD Radeon RX 7900 XT;
| 1080p Gaming | Radeon RX 7900 XT | GeForce RTX 4070 Ti | |
| Assassin Creed Vahalla | 189 | 169 | -11.834% |
| Borderlands 3 : bad ass | 216.11 | 188.93 | -14.386% |
| Cyberpunk2077 | 165.32 | 160.62 | -2.926% |
| Tom Clancy’s The Division 2 | 248 | 248 | 0.000% |
| Metro Exodus | 161.71 | 131.7 | -22.787% |
| Far Cry 6 | 175 | 147 | -19.048% |
| Guardian of Galaxy(ultra) | 152 | 187 | 18.717% |
| Horizon Zero Dawn | 212 | 211 | -0.474% |
| Rainbow Six Siege | 778 | 694 | -12.104% |
| Shadow of the Tomb Raider (highest) | 262 | 243 | -7.819% |
| SpiderMan Miles Moral (Very High) | 135.8 | 169 | 19.645% |
| Total War: Troy | 256.8 | 211.3 | -21.533% |
| WarHammer Darktide(High) | 162.3 | 157 | -3.376% |
| Watch Dog Legion | 158 | 137 | -15.328% |
1080p Gaming – GIGABYTE GeForce RTX 4080 Gaming OC;
| 1080p Gaming | GeForce RTX 4080 | GeForce RTX 4070 Ti | |
| Assassin Creed Vahalla | 189 | 169 | -11.834% |
| Borderlands 3 : bad ass | 224.29 | 188.93 | -18.716% |
| Cyberpunk2077 | 190.73 | 160.62 | -18.746% |
| Tom Clancy’s The Division 2 | 277 | 248 | -11.694% |
| Metro Exodus | 179.24 | 131.7 | -36.097% |
| Far Cry 6 | 154 | 147 | -4.762% |
| Guardian of Galaxy(ultra) | 182 | 187 | 2.674% |
| Horizon Zero Dawn | 229 | 211 | -8.531% |
| Rainbow Six Siege | 728 | 694 | -4.899% |
| Shadow of the Tomb Raider (highest) | 281 | 243 | -15.638% |
| SpiderMan Miles Moral (Very High) | 165 | 169 | 2.367% |
| Total War: Troy | 245.8 | 211.3 | -16.327% |
| WarHammer Darktide(High) | 198.3 | 157 | -26.306% |
| Watch Dog Legion | 144 | 137 | -5.109% |
1080p Gaming – GIGABYTE GeForce RTX 3090 Ti Gaming OC;
| 1080p Gaming | GeForce RTX 3090 Ti | GeForce RTX 4070 Ti | |
| Assassin Creed Vahalla | 154 | 169 | 8.876% |
| Borderlands 3 : bad ass | 190.83 | 188.93 | -1.006% |
| Cyberpunk2077 | 159.37 | 160.62 | 0.778% |
| Tom Clancy’s The Division 2 | 256 | 248 | -3.226% |
| Metro Exodus | 154.15 | 131.7 | -17.046% |
| Far Cry 6 | 154 | 147 | -4.762% |
| Guardian of Galaxy(ultra) | 186 | 187 | 0.535% |
| Horizon Zero Dawn | 209 | 211 | 0.948% |
| Rainbow Six Siege | 696 | 694 | -0.288% |
| Shadow of the Tomb Raider (highest) | 243 | 243 | 0.000% |
| SpiderMan Miles Moral (Very High) | 170 | 169 | -0.592% |
| Total War: Troy | 214.1 | 211.3 | -1.325% |
| WarHammer Darktide(High) | 168.1 | 157 | -7.070% |
| Watch Dog Legion | 139 | 137 | -1.460% |
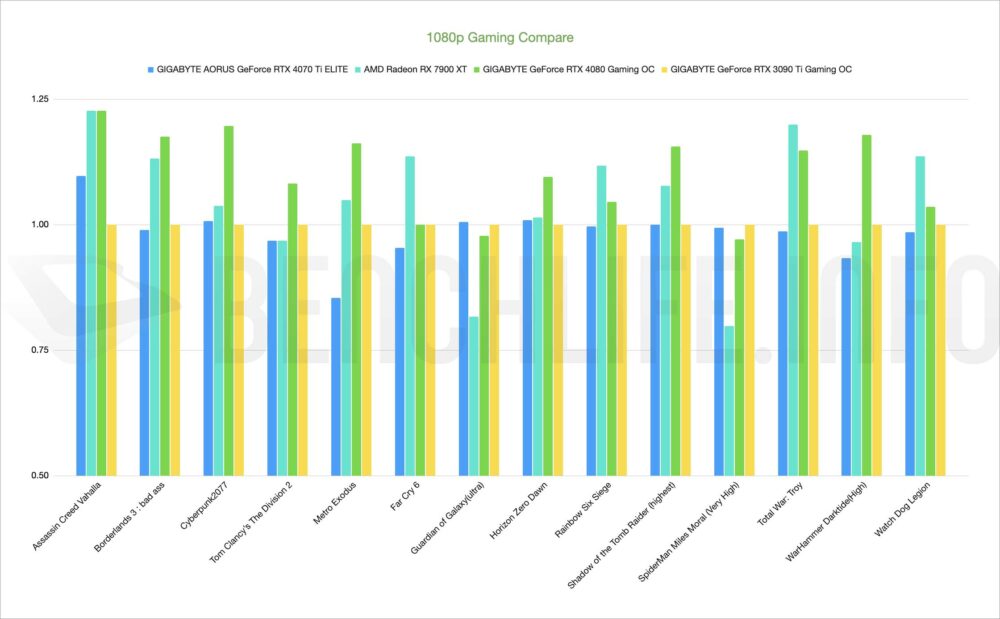
GIGABYTE AORUS GeForce RTX 4070 Ti ELITE 1080p Gaming 比較圖:


