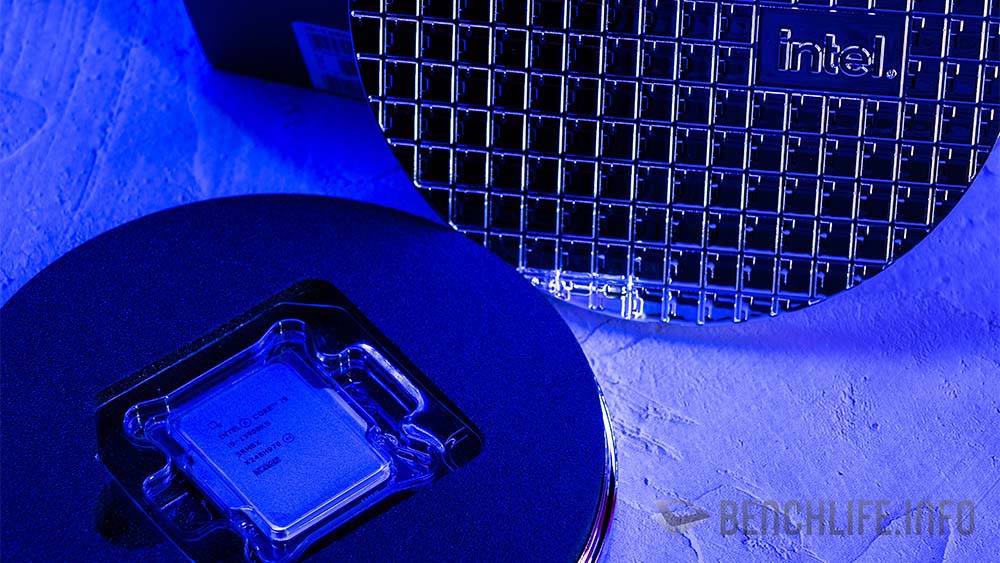
時脈最高可以達到 6.0GHz,來看看它實際表現到底如何。
CES 2023 迎來 65W 的 13 代 Core 系列處理器,緊接著在 1 月 12 日推出處理器核心時脈可以達到 6.0GHz 的 Intel Core i9-13900KS,讓整個 Intel 的 Raptor Lake-S 更為完整。
相較於 Intel Core i9-13900K,新推出的 Intel Core i9-13900KS 的核心時脈推進到 6.0GHz,雖然只是 Max Turbo Boost 與 Thermal Velocity Boost 達到 6.0GHz,但這對整個 x86 架構處理器而言,是一個相當大的推進;Intel Core i9-13900K 是 Max Turbo Boost 與 Thermal Velocity Boost 達到 5.8GHz。
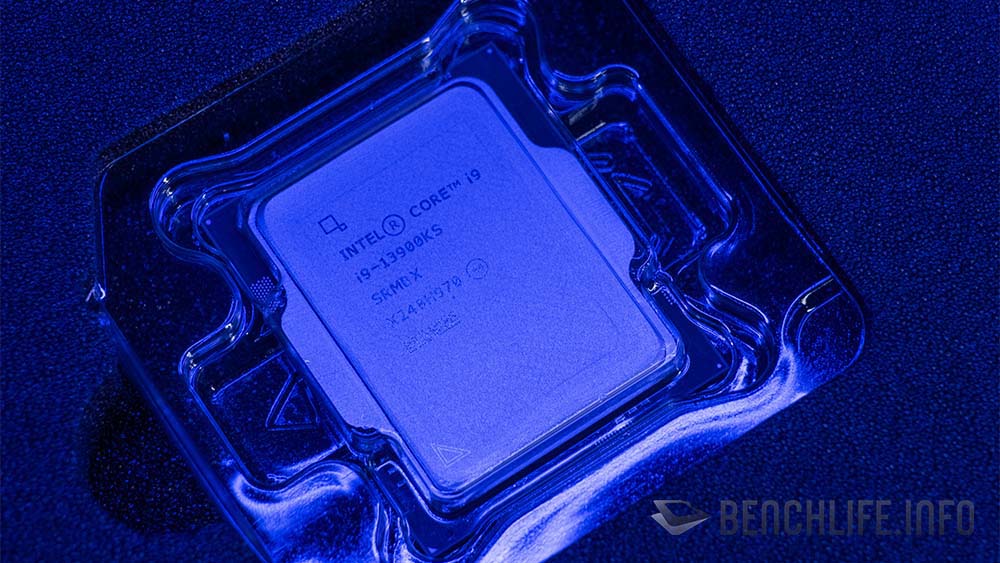
除了更好的晶圓體質外,Intel Core i9-13900KS 的 PL1 與 PL2 在 Extreme Power 模式下更是開放到 320W,高於 Intel Core i9-13900K 的 253W。
Performance Power 模式下,Intel Core i9-13900KS 與 Core i9-13900K 同為 253W。
扣除最高時脈可以達到 6.0GHz,Intel Core i9-13900KS 的 Performance Cores 基本時脈從 3.0GHz 調高至 3.2GHz,同時 Efficient Cores 也從 2.2GHz 提高至 2.4GHz,這樣的作法當然也讓 Intel Core i9-13900K 的 125W TDP 提升至 Intel Core i9-13900KS 的 150W。
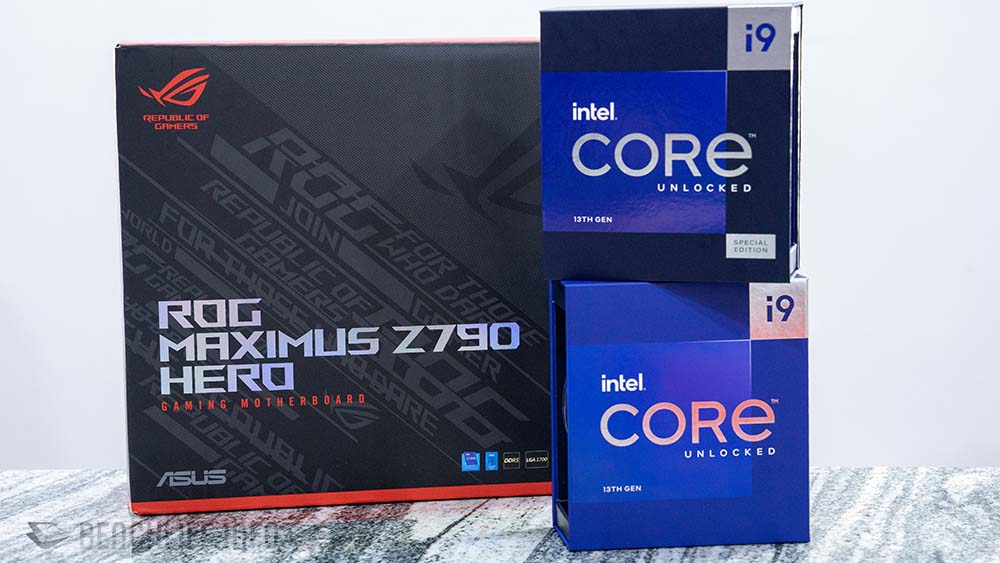
測試部分,我們這次平台使用 ASUS ROG Maximus Z790 Hero 主機板、DDR5-6000 MT/s 記憶體(超頻至 DDR5-6400 MT/s)與 NVIDIA GeForce RTX 4090 Founders Edition 顯示卡,搭配 Intel Core i9-13900K 與 AMD Ryzen 7 5800X3D(使用 Crosshair VIII Hero 主機板)進行測試比較。
3DMark – Intel Core i9-13900K
| 3DMark | Intel Core i9-13900K | Intel Core i9-13900KS | |
|---|---|---|---|
| TIme Spy | 31531 | 32599 | 3.276% |
| Graphic score | 36609 | 36688 | 0.215% |
| CPU score | 17655 | 19981 | 11.641% |
| Time Spy Extreme | 18050 | 18155 | 0.578% |
| Graphic score | 19371 | 19274 | -0.503% |
| CPU score | 13020 | 13663 | 4.706% |
| Fire Strike | 45759 | 46685 | 1.984% |
| Graphic score | 62386 | 65365 | 4.557% |
| Physics score | 54041 | 53383 | -1.233% |
| Combo score | 14176 | 14013 | -1.163% |
| Fire Strike Extreme | 38128 | 38465 | 0.876% |
| Graphic score | 44614 | 45100 | 1.078% |
| Physics score | 54170 | 53564 | -1.131% |
| Combo score | 15044 | 15277 | 1.525% |
| Fire Strike Ultra | 24502 | 24428 | -0.303% |
| Graphic score | 24632 | 24677 | 0.182% |
| Physics score | 54057 | 53658 | -0.744% |
| Combo score | 13178 | 12907 | -2.100% |
| Port Royal | 25698 | 25710 | 0.047% |
| Speed Way | 9762 | 9993 | 2.312% |
| CPU Profile | |||
| Max Threads | 16266 | 16887 | 3.677% |
| 16 threads | 11317 | 11766 | 3.816% |
| 8 threads | 8522 | 9011 | 5.427% |
| 4 threads | 4558 | 4768 | 4.404% |
| 2 threads | 2341 | 2458 | 4.760% |
| 1 threads | 1208 | 1270 | 4.882% |
3DMark – AMD Ryzen 7 5800X3D
| 3DMark | AMD Ryzen 7 5800X3D | Intel Core i9-13900KS | |
|---|---|---|---|
| TIme Spy | 27294 | 32599 | 16.274% |
| Graphic score | 36143 | 36688 | 1.485% |
| CPU score | 11433 | 19981 | 42.781% |
| Time Spy Extreme | 13796 | 18155 | 24.010% |
| Graphic score | 19195 | 19274 | 0.410% |
| CPU score | 5319 | 13663 | 61.070% |
| Fire Strike | 51585 | 46685 | -10.496% |
| Graphic score | 84713 | 65365 | -29.600% |
| Physics score | 29559 | 53383 | 44.628% |
| Combo score | 18324 | 14013 | -30.764% |
| Fire Strike Extreme | 37363 | 38465 | 2.865% |
| Graphic score | 46413 | 45100 | -2.911% |
| Physics score | 29355 | 53564 | 45.196% |
| Combo score | 18198 | 15277 | -19.120% |
| Fire Strike Ultra | 23867 | 24428 | 2.297% |
| Graphic score | 25106 | 24677 | -1.738% |
| Physics score | 29409 | 53658 | 45.192% |
| Combo score | 14444 | 12907 | -11.908% |
| Port Royal | 25324 | 25710 | 1.501% |
| Speed Way | 9869 | 9993 | 1.241% |
| CPU Profile | |||
| Max Threads | 7361 | 16887 | 56.410% |
| 16 threads | 7355 | 11766 | 37.489% |
| 8 threads | 6426 | 9011 | 28.687% |
| 4 threads | 3481 | 4768 | 26.992% |
| 2 threads | 1804 | 2458 | 26.607% |
| 1 threads | 906 | 1270 | 28.661% |
Gaming – Intel Core i9-13900K
| Intel Core i9-13900K | Intel Core i9-13900KS | ||
|---|---|---|---|
| 4K gaming | |||
| Borderlands 3 : bad ass | 130.78 | 130.16 | -0.476% |
| Cyberpunk2077 | 84.37 | 83.27 | -1.321% |
| Metro Exodus | 138.79 | 136.87 | -1.403% |
| F1 22 | 197 | 198 | 0.505% |
| Far Cry 6 | 138 | 139 | 0.719% |
| Rainbow Six Siege | 557 | 563 | 1.066% |
| Shadow of the Tomb Raider(Highest) | 186 | 185 | -0.541% |
| Total War: Troy | 154.4 | 154.3 | -0.065% |
| 1440p Gaming | |||
| Borderlands 3 : bad ass | 227.37 | 226.37 | -0.442% |
| Cyberpunk2077 | 166.68 | 164.36 | -1.412% |
| Metro Exodus | 179.12 | 175.44 | -2.098% |
| F1 22 | 245 | 246 | 0.407% |
| Far Cry 6 | 178 | 179 | 0.559% |
| Rainbow Six Siege | 637 | 658 | 3.191% |
| Shadow of the Tomb Raider(Highest) | 290 | 286 | -1.399% |
| Total War: Troy | 245.1 | 246 | 0.366% |
| 1080p Gaming | |||
| Borderlands 3 : bad ass | 275.46 | 280.23 | 1.702% |
| Cyberpunk2077 | 231.92 | 237.28 | 2.259% |
| Metro Exodus | 189 | 186.99 | -1.075% |
| F1 22 | 272 | 272 | 0.000% |
| Far Cry 6 | 185 | 186 | 0.538% |
| Rainbow Six Siege | 636 | 638 | 0.313% |
| Shadow of the Tomb Raider(Highest) | 311 | 314 | 0.955% |
| Total War: Troy | 294 | 287 | -2.439% |
Gaming – AMD Ryzen 7 5800X3D
| AMD Ryzen 7 5800X3D | Intel Core i9-13900KS | ||
|---|---|---|---|
| 4K gaming | |||
| Borderlands 3 : bad ass | 125.22 | 130.16 | 3.795% |
| Cyberpunk2077 | 84.03 | 83.27 | -0.913% |
| Metro Exodus | 134.07 | 136.87 | 2.046% |
| F1 22 | 193 | 198 | 2.525% |
| Far Cry 6 | 134 | 139 | 3.597% |
| Rainbow Six Siege | 571 | 563 | -1.421% |
| Shadow of the Tomb Raider(Highest) | 186 | 185 | -0.541% |
| Total War: Troy | 152.1 | 154.3 | 1.426% |
| 1440p Gaming | |||
| Borderlands 3 : bad ass | 217.97 | 226.37 | 3.711% |
| Cyberpunk2077 | 162.07 | 164.36 | 1.393% |
| Metro Exodus | 171.59 | 175.44 | 2.194% |
| F1 22 | 240 | 246 | 2.439% |
| Far Cry 6 | 149 | 179 | 16.760% |
| Rainbow Six Siege | 684 | 658 | -3.951% |
| Shadow of the Tomb Raider(Highest) | 291 | 286 | -1.748% |
| Total War: Troy | 229 | 246 | 6.911% |
| 1080p Gaming | |||
| Borderlands 3 : bad ass | 253.93 | 280.23 | 9.385% |
| Cyberpunk2077 | 193.08 | 237.28 | 18.628% |
| Metro Exodus | 181.98 | 186.99 | 2.679% |
| F1 22 | 263 | 272 | 3.309% |
| Far Cry 6 | 152 | 186 | 18.280% |
| Rainbow Six Siege | 680 | 638 | -6.583% |
| Shadow of the Tomb Raider(Highest) | 317 | 314 | -0.955% |
| Total War: Troy | 237.6 | 287 | 17.213% |
CPU and Creator – Intel Core i9-13900K
| Intel Core i9-13900K | Intel Core i9-13900KS | ||
|---|---|---|---|
| Cinebench R23 | |||
| Multi Core | 39620 | 40266 | 1.604% |
| Single Core | 2145 | 2332 | 8.019% |
| Cinebench R20 | |||
| Multi Core | 15531 | 15724 | 1.227% |
| Single Core | 849 | 896 | 5.246% |
| Geekbench | |||
| Single | 2202 | 2293 | 3.969% |
| Multi | 24058 | 26883 | 10.508% |
| CPU-Z | |||
| Single | 934.6 | 979.6 | 4.594% |
| Multi | 16981.5 | 17167.4 | 1.083% |
| PC Mark | |||
| Essential | 12041 | 12547 | 4.033% |
| Productivity | 12881 | 13368 | 3.643% |
| Digtal Content Creation | 19061 | FAIL | - |
| CrossMark | |||
| overall | 2373 | 2604 | 8.871% |
| productivity | 2156 | 2366 | 8.876% |
| creativty | 2779 | 2931 | 5.186% |
| responsiveness | 1971 | 2434 | 19.022% |
| Intel Core i9-13900K | Intel Core i9-13900KS | ||
|---|---|---|---|
| Blender | |||
| Monster | 272 | 272 | 0.000% |
| Junk Store | 161 | 172 | 6.395% |
| classroom | 130 | 133 | 2.256% |
| Indigo Bench | |||
| Bedroom | 4.141 | 4.259 | 2.771% |
| Supercar | 12.509 | 12.784 | 2.151% |
| Pugetbench DaviniCi | |||
| Overall | 3157 | 3357 | 5.958% |
| 4K Media Score | 214 | 215 | 0.465% |
| GPU Effects Score | 275 | 275 | 0.000% |
| Fusion Score | 458 | 517 | 11.412% |
| Pugetbench Premiere Pro | |||
| Overall | 1700 | 1412 | -20.397% |
| Standar Export Score | 134 | 143.8 | 6.815% |
| Standar Live Playback Score | 222.5 | 119.1 | -86.818% |
| Effects Score | 153.4 | 160.5 | 4.424% |
| GPU score | 142.4 | 147.5 | 3.458% |
CPU and Creator – AMD Ryzen 7 5800X3D
| AMD Ryzen 7 5800X3D | Intel Core i9-13900KS | ||
|---|---|---|---|
| Cinebench R23 | |||
| Multi Core | 21055 | 40266 | 47.710% |
| Single Core | 1613 | 2332 | 30.832% |
| Cinebench R20 | |||
| Multi Core | 8261 | 15724 | 47.462% |
| Single Core | 630 | 896 | 29.688% |
| Geekbench | |||
| Single | 1680 | 2293 | 26.734% |
| Multi | 13882 | 26883 | 48.361% |
| CPU-Z | |||
| Single | 676.4 | 979.6 | 30.951% |
| Multi | 9514.6 | 17167.4 | 44.578% |
| #DIV/0! | |||
| PC Mark | #DIV/0! | ||
| Essential | 10057 | 12547 | 19.845% |
| Productivity | 9633 | 13368 | 27.940% |
| Digtal Content Creation | 15412 | FAIL | - |
| CrossMark | |||
| overall | 1443 | 2604 | 44.585% |
| productivity | 1383 | 2366 | 41.547% |
| creativty | 1760 | 2931 | 39.952% |
| responsiveness | 905 | 2434 | 62.818% |
| AMD Ryzen 7 5800X3D | Intel Core i9-13900KS | ||
|---|---|---|---|
| Blender | |||
| Monster | 152 | 272 | 44.118% |
| Junk Store | 99 | 172 | 42.442% |
| classroom | 73.9 | 133 | 44.436% |
| Indigo Bench | |||
| Bedroom | 2.972 | 4.259 | 30.218% |
| Supercar | 6.312 | 12.784 | 50.626% |
| Pugetbench DaviniCi | |||
| Overall | 2437 | 3357 | 27.405% |
| 4K Media Score | 139 | 215 | 35.349% |
| GPU Effects Score | 230 | 275 | 16.364% |
| Fusion Score | 374 | 517 | 27.660% |
| Pugetbench Premiere Pro | |||
| Overall | 821 | 1412 | 41.856% |
| Standar Export Score | 76.8 | 143.8 | 46.592% |
| Standar Live Playback Score | 60.5 | 119.1 | 49.202% |
| Effects Score | 109.1 | 160.5 | 32.025% |
| GPU score | 109.2 | 147.5 | 25.966% |
遊戲部分,Intel Core i9-13900K 與 Intel Core i9-13900KS 的差異並沒有太過於顯著,但部分遊戲可以見到 Intel Core i9-13900KS 是小幅度領先;其餘與 Intel Core i9-13900K 進行比較的部分,也都是 Intel Core i9-13900KS 小幅度領先,只是差距明顯並不太大。
如果與 AMD Ryzen 7 5800X3D 相比較的話,Intel Core i9-13900KS 領先幅度就非常明顯。
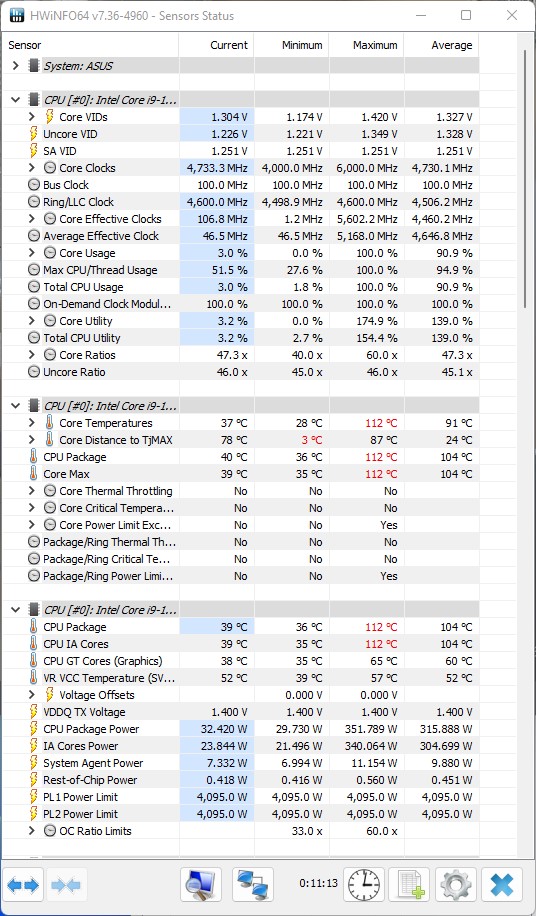
大家可能比較在意 Intel Core i9-13900KS 的功耗與溫度表現,我們透過 Cinebench R23 10 分鐘循環測試,搭配 HWInfo 了解到 Intel Core i9-13900KS 實際表現;這次測試使用的是 ROG RYUJIN II 360 一體式水冷進行,並且將溫度上限開放到 115 度。
測試的最高時脈會衝到 112 度,但 Intel Core i9-13900KS 在執行 Cinebench R23 循環測試中的平均溫度在 91 度。
透過 HWInfo 資訊,我們也可以見到 CPU 功耗最高來到 310W,至於平均則是 315W 左右。
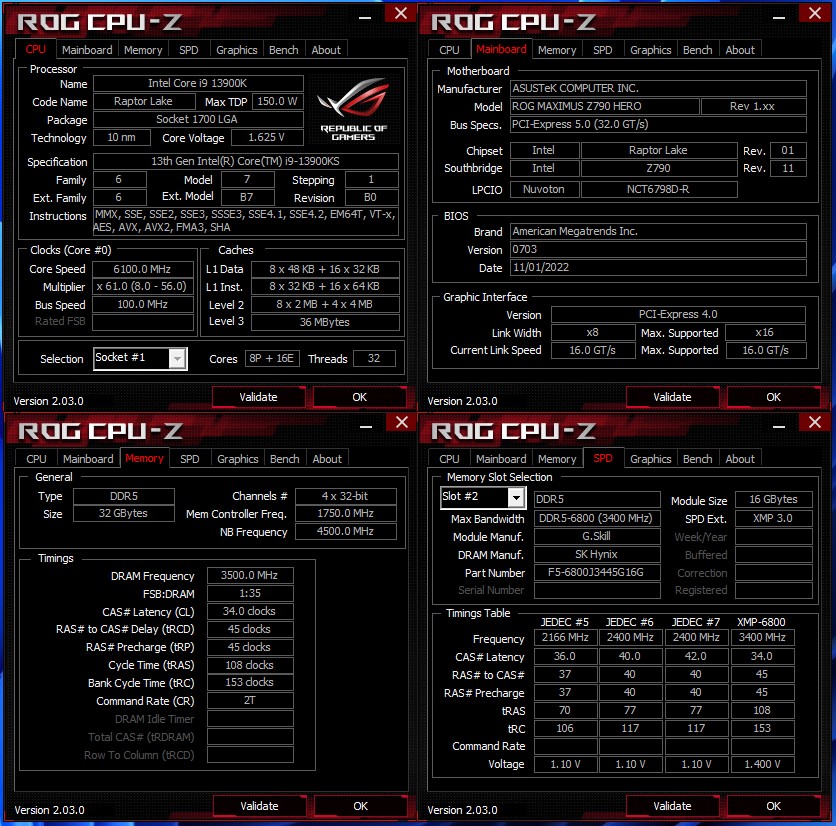
超頻部分,我們試著將 Intel Core i9-13900KS 全核心調整至 6.1GHz,記憶體部分則是達到 DDR5-7000 MT/s。
如果要我們在 Intel Core i9-13900K 與 Intel Core i9-13900KS 做選擇的話,預算充足首選會是 6.0GHz 的 Intel Core i9-13900KS,但 Intel Core i9-13900K 也是一個相當好的選擇。
若想選購 Intel Core i9-13900KS 的玩家,強烈建議搭配一組旗艦級的散熱器,且板子部分不要選擇太入門的 Intel Z790 晶片主機板。
Intel Core i9-13900KS 最高核心可以達到 6.0GHz,雖然只有其中 2 顆 Performance Cores 核心,但已經讓整個 x86 架構處理器來到一個新的境界,這也讓我們期待 Intel 在下一世代處理器會端出新意。