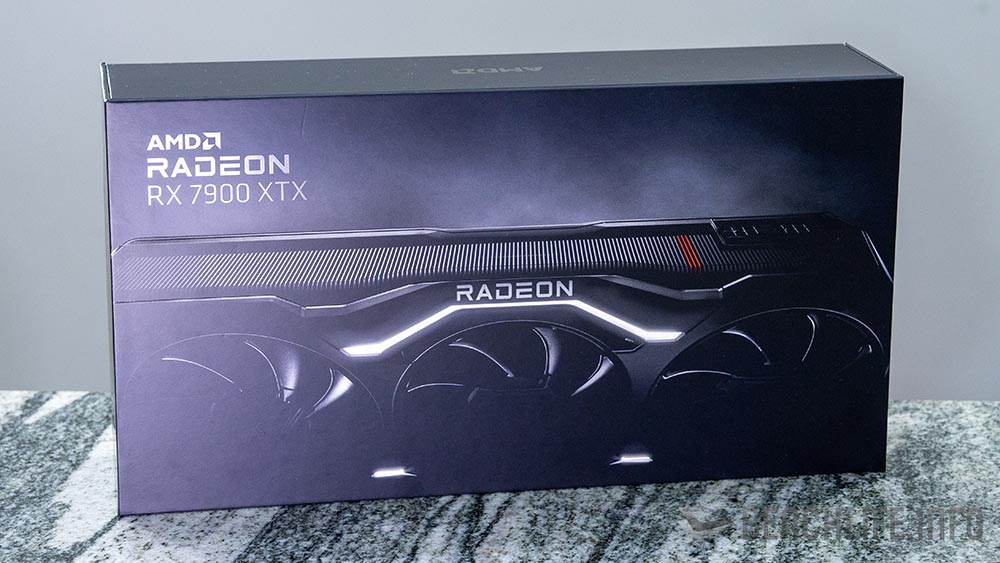
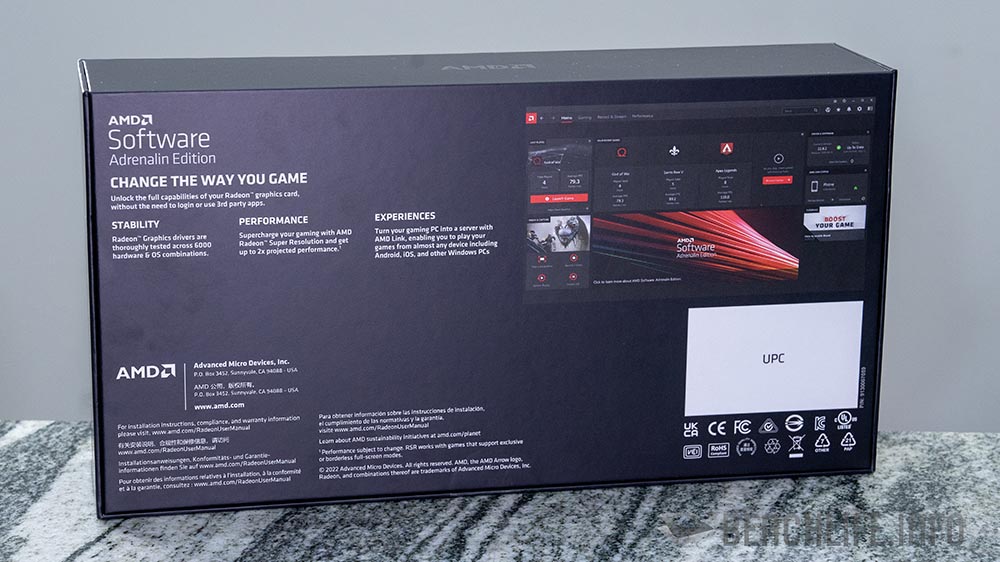
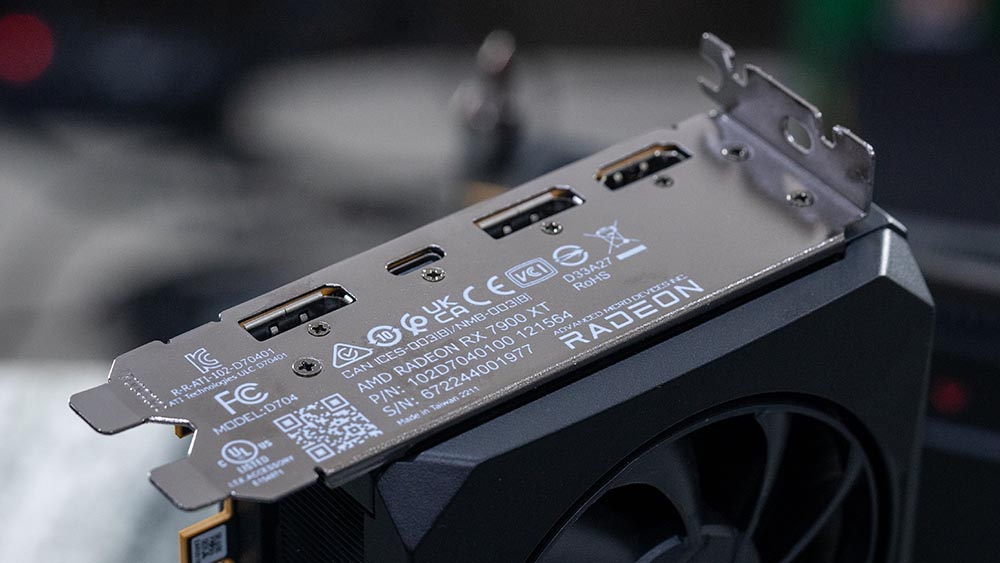
相較於 GeForce RTX 4080,這次 Radeon RX 7900 XTX 表現亮眼許多。
12 月 8 日晚上 Radeon RX 7900 XT 與 Radeon RX 7900 XTX 外觀正式解禁,但台灣部分因為一些技術問題,沒有在這波名單中,但我們也已經在進行相關顯示卡的實測。
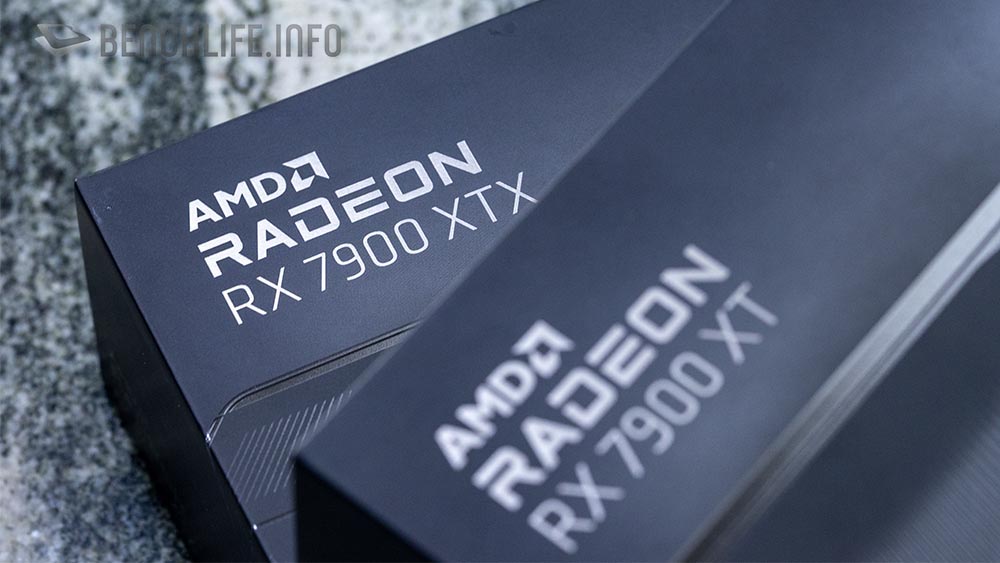
這次 RDNA 3 架構的 Radeon RX 7900 系列顯示卡是首度採用 Chiplet 設計的 Gaming GPU。
在設計上,Radeon RX 7900 系列 GPU 採用的是代號 Navi 31 的產品,其 GPU 是由 1x GPU 與 6x MCD 所組成,採用 2nd Gen 的 AMD Infinity Cache 技術,讓資料可以在 5.3TB/s 的頻寬下進行高速傳輸。除了 2nd Gen Infinity Cache 技術,RDNA 3 還整合了全新的 AI 加速器、2nd Gen RT 加速器以及全新的 AMD Radiance Display Engine。
AMD 在 Reviewer Guide 中提到 3 款顯示卡的 Infinity Cache 數據:
– Radeon RX 6950 XT:128MB 1st Gen Infinity Cache,18Gbps GDDR6 記憶體與 256 bit 記憶體匯流排,提供 1793.5 GB/s 頻寬;
– Radeon RX 7900 XT:80MB 2nd Gen Infinity Cache,20Gbps GDDR6 記憶體與 320 bit 記憶體匯流排,提供 2912 GB/s 頻寬;
– Radeon RX 7900 XTX:96MB 2nd Gen Infinity Cache,20Gbps GDDR6 記憶體與 384 記憶體匯流排,提供 3494.4 GB/s 頻寬;
RDNA 3 架構的 Radeon RX 7000 系列還擁有針對 AV1 編碼與解碼用的硬體加速引擎,讓顯示卡可以支援 8K60 的高畫質。
| VP9 | H.264 | H.265 | AV1 | |
|---|---|---|---|---|
| Decode | 4K210 8K48 (4:2:0 8 / 10b) | 4K330 (4:2:0 8b) | 4K210 8K48 (4:2:0 8 / 10b) | 4K240 8K60 (4:2:0 8 / 10 / 12b) |
| Encode | -- | 4K180 (4:2:0 8b) | 4K180 8K48 (4:2:0 8 / 10b) | 4K240 8K60 (4:2:0 8 / 10b) |
至於 AMD Radiance Display Engine 主要就是 Radeon RX 7900 系列顯示卡加入了 DisplayPort 2.1,透過其 54Gbps 的頻寬,讓顯示卡可以輸出 8K 165Hz 或 4K 480Hz 的影像;如果是 DisplayPort 1.4 的話,至多只能達到 8K 60Hz 或 4K 240Hz。
| Radeon RX 6950 XT | Radeon RX 7900 Series | |
|---|---|---|
| DisplayPort Version | DisplayPort 1.4 | DisplayPort 2.1 |
| Refresh Rate - 1440p(Max) | 480Hz | 900Hz |
| Refresh Rate - 4K(Max) | 240Hz | 480Hz |
| Refresh Rate - 8K(Max) | 60Hz | 165Hz |
現階段我們仍未見到任何支援 DisplayPort 2.1 的螢幕,但就 AMD 在發表會提到的,預計在 2023 年初,我們將可以見到不少品牌推出相關螢幕。
| Radeon RX 6950 XT | Radeon RX 7900 XT | Radeon RX 7900 XTX | |
|---|---|---|---|
| Architecture | RDNA 2 | RDNA 3 | RDNA 3 |
| Process | 7nm | 5nm GCD + 6nm MCD | 5nm GCD + 6nm MCD |
| Transistor Count | 26.8b | 57.7b | 57.7b |
| Die Size | 520mm2 | 300mm2 GCD 220mm2 MCD | 300mm2 GCD 220mm2 MCD |
| Compute Units | 80 | 84 | 96 |
| Ray Accelerators | 80 | 84 | 96 |
| AI Accelerators | - | 168 | 192 |
| Stream Processors | 5120 | 5376 | 6144 |
| Game GPU Clock | 2100MHz | 2000MHz | 2300MHz |
| Boost GPU Clock | Up to 2310MHz | Up to 2400MHz | Up to 2500MHz |
| ROPs | 128 | 192 | 192 |
| AMD Infinity Cache | 128MB | 80MB | 96MB |
| Memory | 16GB GDDR6 | 20GB GDDR6 | 24GB GDDR6 |
| Effective Memory Bandwidth with AMD Infinity Cache | Up to 1793.5GB/s | Up to 2900GB/s | Up to 3500GB/s |
| Memory Bus Interface | 256 bit | 320 bit | 384 bit |
| PCIe Interface | PCIe 4.0 x16 | PCIe 4.0 x16 | PCIe 4.0 x16 |
| Board Power(TBP) | 335W | 315W | 355W |
AMD Radeon RX 7900 XTX 的整體功耗(Total Board Power, TBP)為 355W,建議搭配 800W 的電源供應器;Radeon RX 7900 XT 的整體功耗(Total Board Power, TBP)為 315W,建議搭配 750W 的電源供應器。
就數字來看,AMD Radeon RX 7900 XTX 的功耗是高於 NVIDIA GeForce RTX 4080 的 320W(Total Graphics Power, TGP);雖然 Radeon RX 7900 XT 稍微低於 GeForce RTX 4080,但某個程度來說,這樣可以算是打成平手,或者是在同一個區間內。
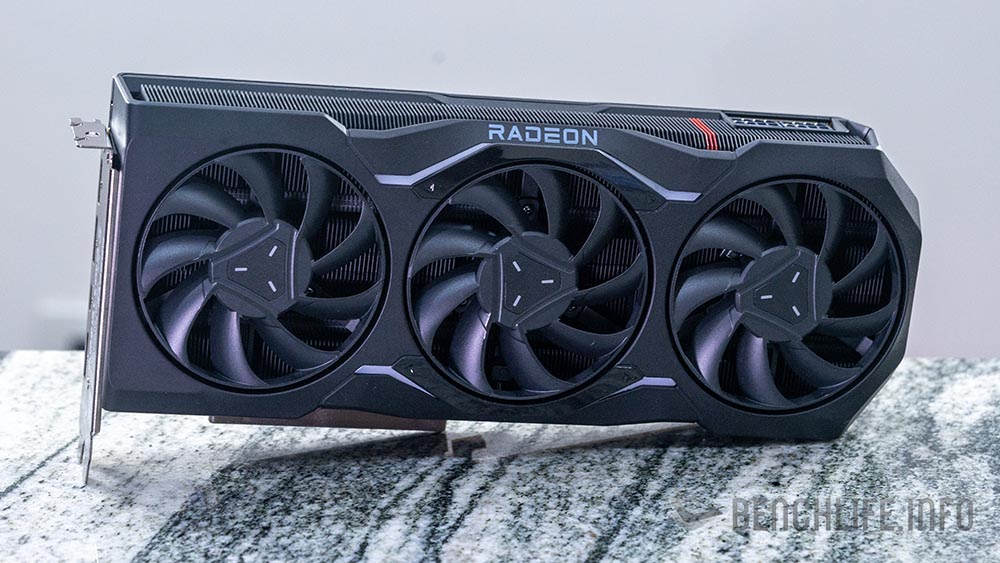
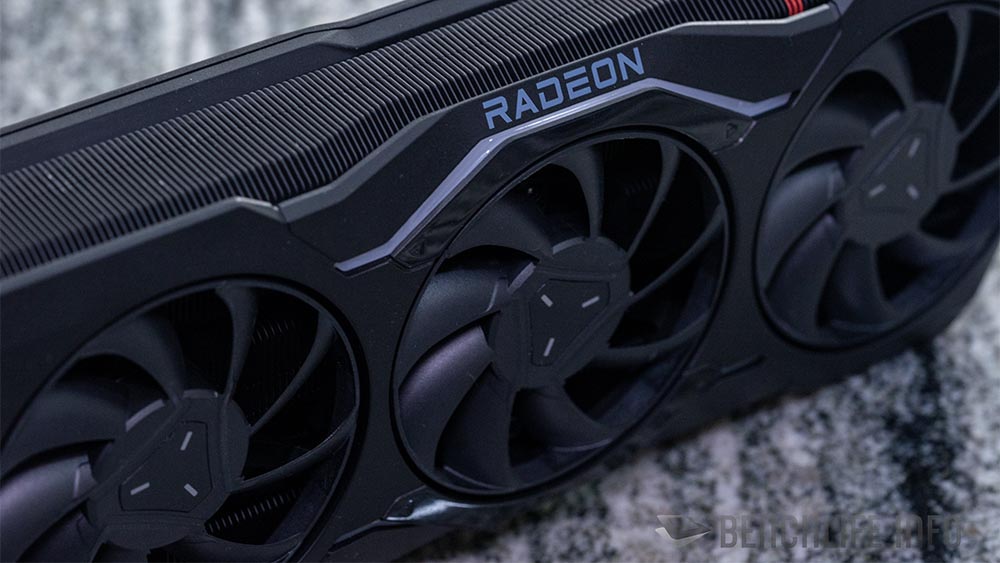
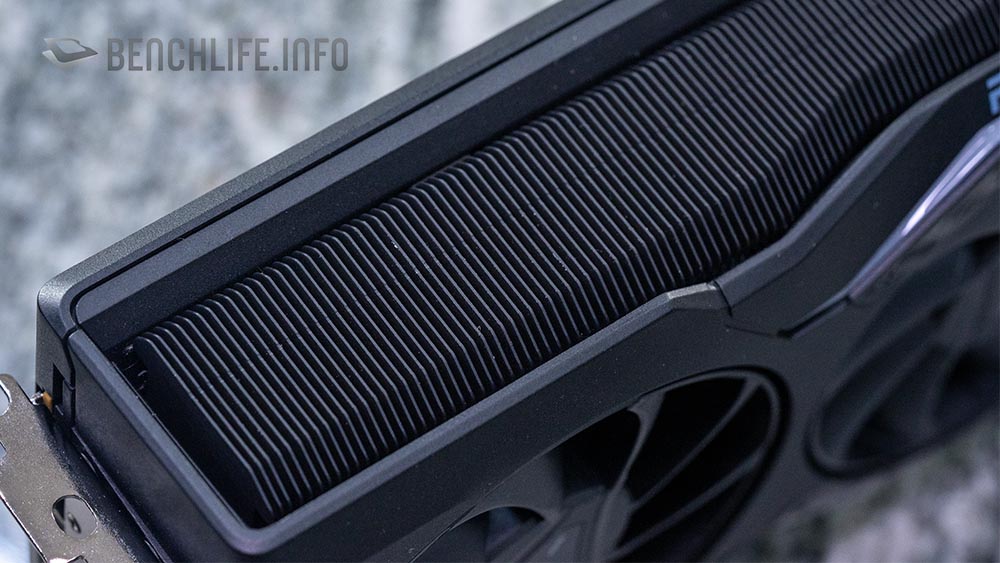
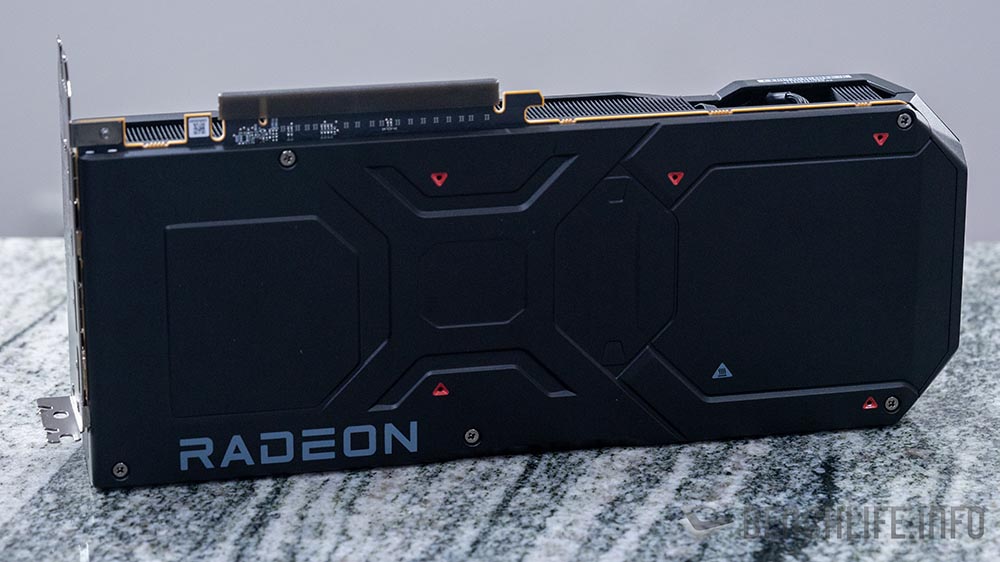
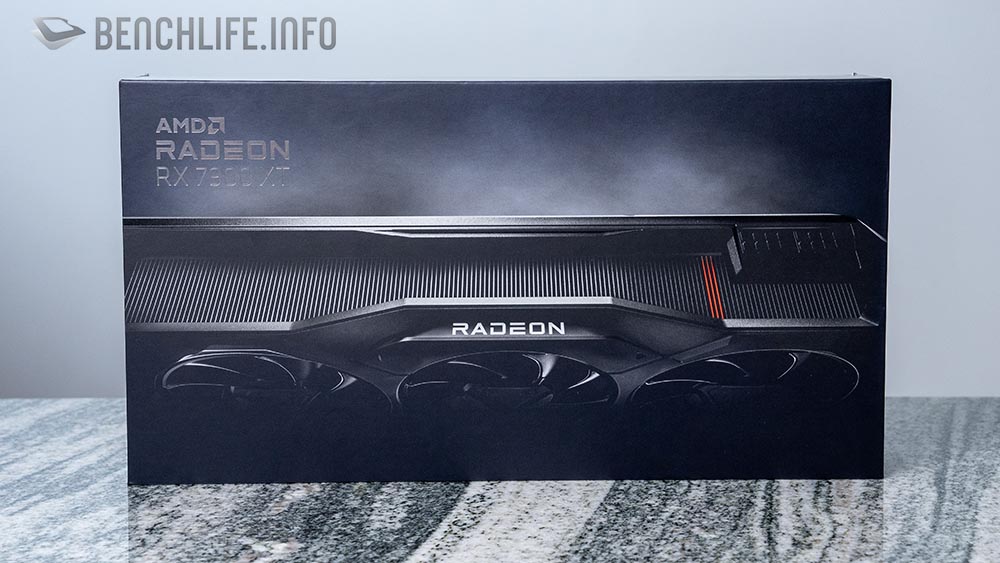
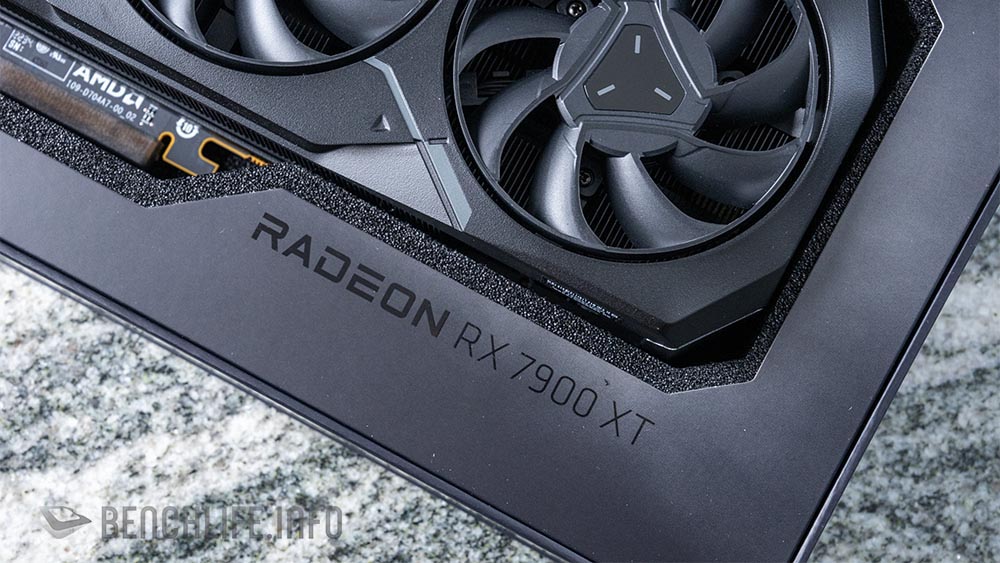
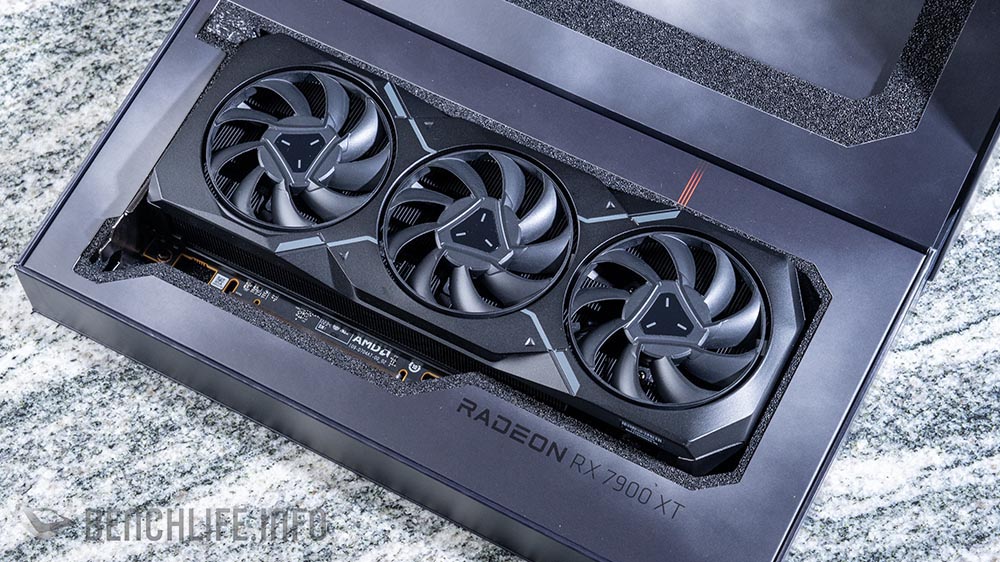
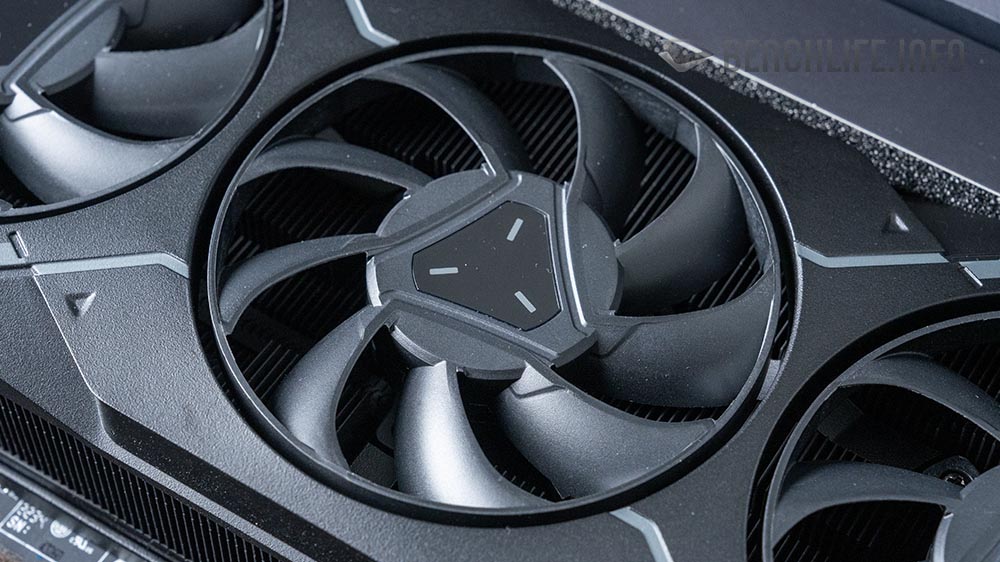
說了那麼多,來看看 AMD Radeon RX 7900 XTX 與 Radeon RX 7900 XT 顯示卡。
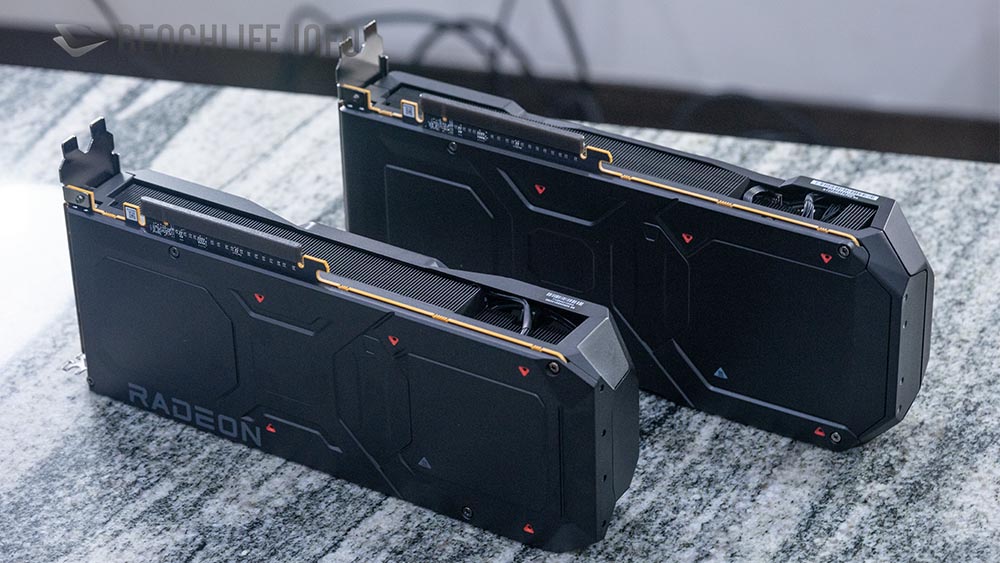
實際上 2 張顯示卡並不是同一張 PCB,因為 Radeon RX 7900 XT 整體要比 Radeon RX 7900 XTX 小,為何 AMD 不放 2 款顯示卡採用相同 PCB,這樣共用散熱模組的前提下,也許就能省下不少時間與成本。
AMD Radeon RX 7900 XTX
AMD Radeon RX 7900 XT
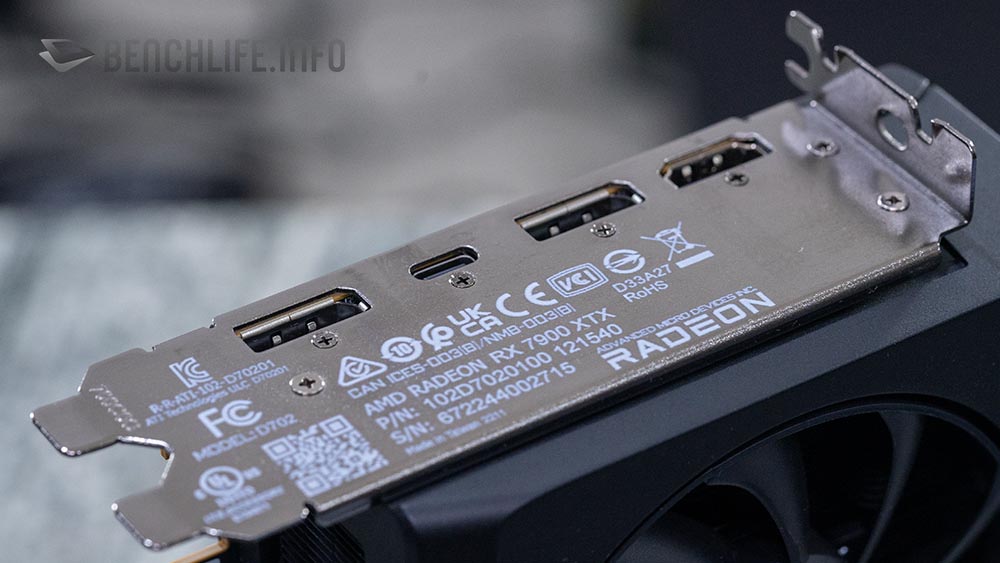
MBA(Made By AMD)版本的 AMD Radeon RX 7900 系列顯示卡在 I/O 部分加入 USB-C,方便使用者透過 USB-C 傳出線輸出訊號至擁有 USB-C 的螢幕。至於各 AIB 的自製卡部分,可能都會將 USB-C 移除,更換為 DisplayPort 供使用。
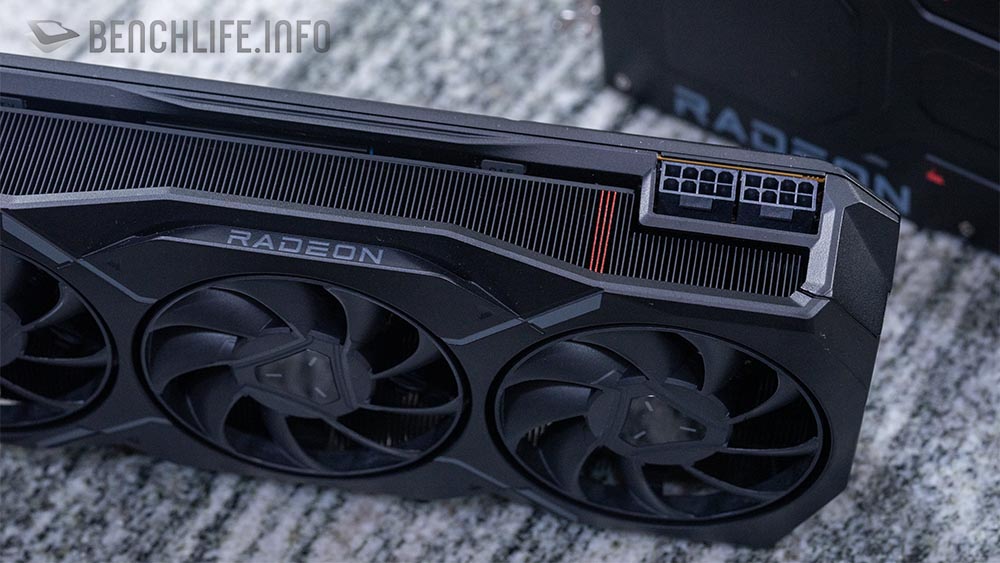
NVIDIA 從 GeForce RTX 3090 Ti 開始強制使用 12VHPWR(12 + 4 Pin)接頭,AMD 這裡依舊保留了 PCIe 8 Pin。
某程度來說,AMD 雖然較為保守,但在不需要更換電源供應器,也不需要額外的轉接線的情況下,這樣的作法對於大部分使用者來說,確是件相當不錯的事情。
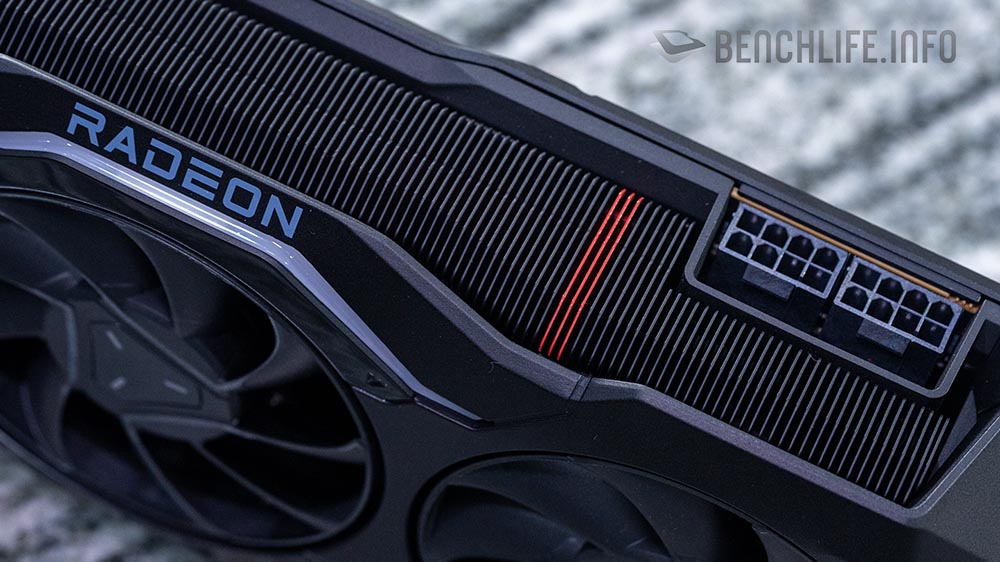
Radeon RX 7900 XTX 散熱器具有發光功能,而 Radeon RX 7900 XT 則沒有。
以 999 美元的訂價,很明顯這次 AMD Radeon RX 7900 XT 就是鎖定 1,190 美元的 NVIDIA GeForce RTX 4080,至於 899 美元的 Radeon RX 7900 XT 則是鎖定原本命名為 GeForce RTX 4080 12GB,但現在更名為 GeForce RTX 4070 Ti 的顯示卡。
不過,現階段 GeForce RTX 4070 Ti 尚未正式發表,因此數據上沒有辦法提供讓大家參考。
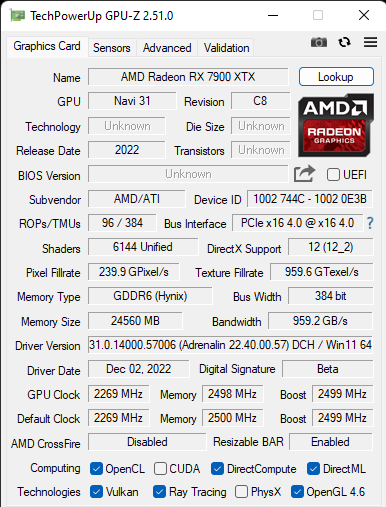
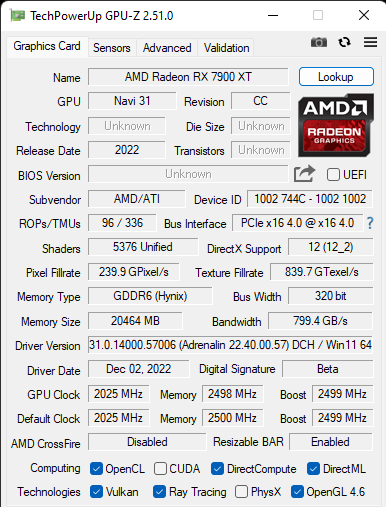
針對 Radeon RX 7900 系列顯示卡的實測,我們使用 AMD Ryzen 9 7900X 搭配 DDR5-6000 MT/s 記憶體進行;顯示卡部分包含 Radeon RX 7900 XTX、Radeon RX 7900 XT、Radeon RX 6950 XT 與 NVIDIA GeForce RTX 4080。
一開始當然就是來看看 4 張顯示卡在 3DMark 的各項數據。
Radeon RX 7900 XTX vs Radeon RX 6950 XT:
| 3DMark | Radeon RX 6950 XT | Radeon RX 7900 XTX | |
|---|---|---|---|
| TIme Spy | 19891 | 25636 | 22.410% |
| Graphic score | 20751 | 28897 | 28.190% |
| CPU score | 16112 | 15638 | -3.031% |
| Time Spy Extreme | 10250 | 13522 | 24.198% |
| Graphic score | 10276 | 14366 | 28.470% |
| CPU score | 10109 | 10148 | 0.384% |
| Fire Strike | 45628 | 51626 | 11.618% |
| Graphic score | 60518 | 76904 | 21.307% |
| Physics score | 42117 | 41545 | -1.377% |
| Combo score | 16774 | 16647 | -0.763% |
| Fire Strike Extreme | 28171 | 35088 | 19.713% |
| Graphic score | 29707 | 39365 | 24.534% |
| Physics score | 42087 | 41376 | -1.718% |
| Combo score | 14957 | 17177 | 12.924% |
| Fire Strike Ultra | 14845 | 19906 | 25.424% |
| Graphic score | 14828 | 20070 | 26.119% |
| Physics score | 42198 | 41663 | -1.284% |
| Combo score | 7561 | 10793 | 29.945% |
| Port Royal | 10333 | 15522 | 33.430% |
| Ray Tracing | 28.17 | 48.84 | 42.322% |
| Speed Way | 3816 | 5769 | 33.853% |
| PCIE bandwidth | 27.43 | 26.42 | -3.823% |
Radeon RX 7900 XT vs Radeon RX 6950 XT:
| 3DMark | Radeon RX 6950 XT | Radeon RX 7900 XT | |
|---|---|---|---|
| TIme Spy | 19891 | 22944 | 13.306% |
| Graphic score | 20751 | 25074 | 17.241% |
| CPU score | 16112 | 15489 | -4.022% |
| Time Spy Extreme | 10250 | 11845 | 13.466% |
| Graphic score | 10276 | 12203 | 15.791% |
| CPU score | 10109 | 10160 | 0.502% |
| Fire Strike | 45628 | 48233 | 5.401% |
| Graphic score | 60518 | 68377 | 11.494% |
| Physics score | 42117 | 41969 | -0.353% |
| Combo score | 16774 | 16214 | -3.454% |
| Fire Strike Extreme | 28171 | 30778 | 8.470% |
| Graphic score | 29707 | 33458 | 11.211% |
| Physics score | 42087 | 41586 | -1.205% |
| Combo score | 14957 | 15462 | 3.266% |
| Fire Strike Ultra | 14845 | 16846 | 11.878% |
| Graphic score | 14828 | 16887 | 12.193% |
| Physics score | 42198 | 41542 | -1.579% |
| Combo score | 7561 | 8822 | 14.294% |
| Port Royal | 10333 | 13263 | 22.092% |
| Ray Tracing | 28.17 | 40.96 | 31.226% |
| Speed Way | 3816 | 4857 | 21.433% |
| PCIE bandwidth | 27.43 | 26.29 | -4.336% |
Radeon RX 7900 XTX vs GeForce RTX 4080:
| 3DMark | GeForce RTX 4080 | Radeon RX 7900 XTX | |
|---|---|---|---|
| Time Spy | 25291 | 25636 | 1.346% |
| Graphic score | 27958 | 28897 | 3.249% |
| CPU score | 16418 | 15638 | -4.988% |
| Time Spy Extreme | 13167 | 13522 | 2.625% |
| Graphic score | 13921 | 14366 | 3.098% |
| CPU score | 10078 | 10148 | 0.690% |
| Fire Strike | 45371 | 51626 | 12.116% |
| Graphic score | 61983 | 76904 | 19.402% |
| Physics score | 41245 | 41545 | 0.722% |
| Combo score | 15864 | 16647 | 4.704% |
| Fire Strike Extreme | 30856 | 35088 | 12.061% |
| Graphic score | 32663 | 39365 | 17.025% |
| Physics score | 42559 | 41376 | -2.859% |
| Combo score | 16888 | 17177 | 1.682% |
| Fire Strike Ultra | 17199 | 19906 | 13.599% |
| Graphic score | 16945 | 20070 | 15.571% |
| Physics score | 42594 | 41663 | -2.235% |
| Combo score | 9653 | 10793 | 10.562% |
| Port Royal | 17819 | 15522 | -14.798% |
| Ray Tracing | 84.36 | 48.84 | -72.727% |
| Speed Way | 7099 | 5769 | -23.054% |
| PCIE bandwidth | 26.82 | 26.42 | -1.514% |
Radeon RX 7900 XT vs GeForce RTX 4080:
| 3DMark | GeForce RTX 4080 | Radeon RX 7900 XT | |
|---|---|---|---|
| TIme Spy | 25291 | 22944 | -10.229% |
| Graphic score | 27958 | 25074 | -11.502% |
| CPU score | 16418 | 15489 | -5.998% |
| Time Spy Extreme | 13167 | 11845 | -11.161% |
| Graphic score | 13921 | 12203 | -14.079% |
| CPU score | 10078 | 10160 | 0.807% |
| Fire Strike | 45371 | 48233 | 5.934% |
| Graphic score | 61983 | 68377 | 9.351% |
| Physics score | 41245 | 41969 | 1.725% |
| Combo score | 15864 | 16214 | 2.159% |
| Fire Strike Extreme | 30856 | 30778 | -0.253% |
| Graphic score | 32663 | 33458 | 2.376% |
| Physics score | 42559 | 41586 | -2.340% |
| Combo score | 16888 | 15462 | -9.223% |
| Fire Strike Ultra | 17199 | 16846 | -2.095% |
| Graphic score | 16945 | 16887 | -0.343% |
| Physics score | 42594 | 41542 | -2.532% |
| Combo score | 9653 | 8822 | -9.420% |
| Port Royal | 17819 | 13263 | -34.351% |
| Ray Tracing | 84.36 | 40.96 | -105.957% |
| Speed Way | 7099 | 4857 | -46.160% |
| PCIE bandwidth | 26.82 | 26.29 | -2.016% |
Radeon RX 7900 XTX vs Radeon RX 7900 XT:
| 3DMark | Radeon RX 7900 XT | Radeon RX 7900 XTX | |
|---|---|---|---|
| TIme Spy | 22944 | 25636 | 10.501% |
| Graphic score | 25074 | 28897 | 13.230% |
| CPU score | 15489 | 15638 | 0.953% |
| Time Spy Extreme | 11845 | 13522 | 12.402% |
| Graphic score | 12203 | 14366 | 15.056% |
| CPU score | 10160 | 10148 | -0.118% |
| Fire Strike | 48233 | 51626 | 6.572% |
| Graphic score | 68377 | 76904 | 11.088% |
| Physics score | 41969 | 41545 | -1.021% |
| Combo score | 16214 | 16647 | 2.601% |
| Fire Strike Extreme | 30778 | 35088 | 12.283% |
| Graphic score | 33458 | 39365 | 15.006% |
| Physics score | 41586 | 41376 | -0.508% |
| Combo score | 15462 | 17177 | 9.984% |
| Fire Strike Ultra | 16846 | 19906 | 15.372% |
| Graphic score | 16887 | 20070 | 15.859% |
| Physics score | 41542 | 41663 | 0.290% |
| Combo score | 8822 | 10793 | 18.262% |
| Port Royal | 13263 | 15522 | 14.554% |
| Ray Tracing | 40.96 | 48.84 | 16.134% |
| Speed Way | 4857 | 5769 | 15.809% |
| PCIE bandwidth | 26.29 | 26.42 | 0.492% |
跟著就是 4 款顯示卡在 4K 解析度下的各遊戲表現。
Radeon RX 7900 XTX vs Radeon RX 6950 XT:
| 4K gaming | Radeon RX 6950 XT | Radeon RX 7900 XTX | |
|---|---|---|---|
| Assassin Creed Vahalla | 79 | 102 | 22.549% |
| Borderlands 3 : bad ass | 73.78 | 105.33 | 29.953% |
| Cyberpunk2077 | 43.58 | 68.08 | 35.987% |
| Cyberpunk2077 +RT | 12.97 | 20.4 | 36.422% |
| Cyberpunk2077 +RT+DLSS3/FSR Performance | 43.22 | 56.39 | 23.355% |
| Tom Clancy’s The Division 2 | 79 | 112 | 29.464% |
| Metro Exodus | 75.54 | 100.08 | 24.520% |
| Metro Exodus(RT_high) | 42.45 | 58.26 | 27.137% |
| F1 22 | 148 | 196 | 24.490% |
| F1 22 (Ray Tracing_Ultra_high) | 35 | 55 | 36.364% |
| F1 22 (Ray Tracing+DLSS_Quality) | 81 | 113 | 28.319% |
| Far Cry 6 | 92 | 123 | 25.203% |
| Forza Horzion 5 (Extreme/RT off) | 102 | 118 | 13.559% |
| Forza Horzion 5 (Extreme/RT ON) | 90 | 105 | 14.286% |
| Horizon Zero Dawn | 91 | 117 | 22.222% |
| Rainbow Six Siege | 329 | 397 | 17.128% |
| Shadow of the Tomb Raider (highest) | 96 | 129 | 25.581% |
| SpiderMan Miles Moral (Very High) | 62 | 88.7 | 30.101% |
| SpiderMan Miles Moral (Very High + RT) | 26 | 36 | 27.778% |
| SpiderMan Miles Moral (Very High + RT+ DLSS/FSR Perf) | - | 75.6 | - |
| Total War: Troy | 98.3 | 134 | 26.642% |
| WarHammer Darktide(High) | 46.2 | 65.7 | 29.680% |
| Watch Dog Legion | 68 | 96 | 29.167% |
| Watch Dog Legion(RT_Ultra) | 26 | 39 | 33.333% |
Radeon RX 7900 XT vs Radeon RX 6950 XT:
| 4K gaming | Radeon RX 6950 XT | Radeon RX 7900 XT | |
|---|---|---|---|
| Assassin Creed Vahalla | 79 | 87 | 9.195% |
| Borderlands 3 : bad ass | 73.78 | 88.51 | 16.642% |
| Cyberpunk2077 | 43.58 | 57.98 | 24.836% |
| Cyberpunk2077 +RT | 12.97 | 17.07 | 24.019% |
| Cyberpunk2077 +RT+DLSS3/FSR Performance | 43.22 | 49.55 | 12.775% |
| Tom Clancy’s The Division 2 | 79 | 93 | 15.054% |
| Metro Exodus | 75.54 | 88.36 | 14.509% |
| Metro Exodus(RT_high) | 42.45 | 48.79 | 12.994% |
| F1 22 | 148 | 161 | 8.075% |
| F1 22 (Ray Tracing_Ultra_high) | 35 | 46 | 23.913% |
| F1 22 (Ray Tracing+DLSS_Quality) | 81 | 98 | 17.347% |
| Far Cry 6 | 92 | 105 | 12.381% |
| Far Cry 6 (RT) | 76 | 89 | 14.607% |
| Forza Horzion 5 (Extreme/RT off) | 102 | 103 | 0.971% |
| Forza Horzion 5 (Extreme/RT ON) | 90 | 92 | 2.174% |
| Horizon Zero Dawn | 91 | 97 | 6.186% |
| Rainbow Six Siege | 329 | 370 | 11.081% |
| Shadow of the Tomb Raider (highest) | 96 | 108 | 11.111% |
| Shadow of the Tomb Raider (RT) | 55 | 65 | 15.385% |
| SpiderMan Miles Moral (Very High) | 62 | 80.4 | 22.886% |
| SpiderMan Miles Moral (Very High + RT) | 26 | 28.7 | 9.408% |
| SpiderMan Miles Moral (Very High + RT+ DLSS/FSR Perf) | - | 63.4 | - |
| Total War: Troy | 98.3 | 116.4 | 15.550% |
| WarHammer Darktide(High) | 46.2 | 55.1 | 16.152% |
| Watch Dog Legion | 68 | 82 | 17.073% |
| Watch Dog Legion(RT_Ultra) | 26 | 33 | 21.212% |
Radeon RX 7900 XTX vs GeForce RTX 4080:
| 4K gaming | GeForce RTX 4080 | Radeon RX 7900 XTX | |
|---|---|---|---|
| Assassin Creed Vahalla | 95 | 102 | 6.863% |
| Borderlands 3 : bad ass | 90.22 | 105.33 | 14.345% |
| Cyberpunk2077 | 64.8 | 68.08 | 4.818% |
| Cyberpunk2077 +RT | 30.81 | 20.4 | -51.029% |
| Cyberpunk2077 +RT+DLSS3/FSR Performance | 83.31 | 56.39 | -47.739% |
| Tom Clancy’s The Division 2 | 115 | 112 | -2.679% |
| Metro Exodus | 104.33 | 100.08 | -4.247% |
| Metro Exodus(RT_high) | 74.93 | 58.26 | -28.613% |
| F1 22 | 162 | 196 | 17.347% |
| F1 22 (Ray Tracing_Ultra_high) | 61 | 55 | -10.909% |
| F1 22 (Ray Tracing+DLSS_Quality) | 100 | 113 | 11.504% |
| Far Cry 6 | 110 | 123 | 10.569% |
| Far Cry 6 (RT) | 96 | 104 | 7.692% |
| Forza Horzion 5 (Extreme/RT off) | 121 | 118 | -2.542% |
| Forza Horzion 5 (Extreme/RT ON) | 112 | 105 | -6.667% |
| Horizon Zero Dawn | 117 | 117 | 0.000% |
| Rainbow Six Siege | 410 | 397 | -3.275% |
| Shadow of the Tomb Raider (highest) | 134 | 129 | -3.876% |
| Shadow of the Tomb Raider (RT) | 88 | 77 | -14.286% |
| SpiderMan Miles Moral (Very High) | 103.4 | 88.7 | -16.573% |
| SpiderMan Miles Moral (Very High + RT) | 49.7 | 36 | -187.222% |
| SpiderMan Miles Moral (Very High + RT+ DLSS/FSR Perf) | 109.8 | 75.6 | 34.259% |
| Total War: Troy | 118.7 | 134 | 18.060% |
| WarHammer Darktide(High) | 65.7 | 65.7 | -80.670% |
| Watch Dog Legion | 87 | 96 | 31.563% |
| Watch Dog Legion(RT_Ultra) | 46 | 39 | -123.077% |
Radeon RX 7900 XT vs GeForce RTX 4080:
| 4K gaming | GeForce RTX 4080 | Radeon RX 7900 XT | |
|---|---|---|---|
| Assassin Creed Vahalla | 95 | 87 | -9.195% |
| Borderlands 3 : bad ass | 90.22 | 88.51 | -1.932% |
| Cyberpunk2077 | 64.8 | 57.98 | -11.763% |
| Cyberpunk2077 +RT | 30.81 | 17.07 | -80.492% |
| Cyberpunk2077 +RT+DLSS3/FSR Performance | 83.31 | 49.55 | -68.133% |
| Tom Clancy’s The Division 2 | 115 | 93 | -23.656% |
| Metro Exodus | 104.33 | 88.36 | -18.074% |
| Metro Exodus(RT_high) | 74.93 | 48.79 | -53.577% |
| F1 22 | 162 | 161 | -0.621% |
| F1 22 (Ray Tracing_Ultra_high) | 61 | 46 | -32.609% |
| F1 22 (Ray Tracing+DLSS_Quality) | 100 | 98 | -2.041% |
| Far Cry 6 | 110 | 105 | -4.762% |
| Far Cry 6 (RT) | 96 | 89 | -7.865% |
| Forza Horzion 5 (Extreme/RT off) | 121 | 103 | -17.476% |
| Forza Horzion 5 (Extreme/RT ON) | 112 | 92 | -21.739% |
| Horizon Zero Dawn | 117 | 97 | -20.619% |
| Rainbow Six Siege | 410 | 370 | -10.811% |
| Shadow of the Tomb Raider (highest) | 134 | 108 | -24.074% |
| Shadow of the Tomb Raider (RT) | 88 | 65 | -35.385% |
| SpiderMan Miles Moral (Very High) | 103.4 | 80.4 | -28.607% |
| SpiderMan Miles Moral (Very High + RT) | 49.7 | 28.7 | -73.171% |
| SpiderMan Miles Moral (Very High + RT+ DLSS/FSR Perf) | 109.8 | 63.4 | -73.186% |
| Total War: Troy | 118.7 | 116.4 | -1.976% |
| WarHammer Darktide(High) | 65.7 | 55.1 | -19.238% |
| Watch Dog Legion | 87 | 82 | -6.098% |
| Watch Dog Legion(RT_Ultra) | 46 | 33 | -39.394% |
Radeon RX 7900 XTX vs Radeon RX 7900 XT:
| 4K gaming | GeForce RTX 4080 | Radeon RX 7900 XTX | |
|---|---|---|---|
| Assassin Creed Vahalla | 95 | 102 | 6.863% |
| Borderlands 3 : bad ass | 90.22 | 105.33 | 14.345% |
| Cyberpunk2077 | 64.8 | 68.08 | 4.818% |
| Cyberpunk2077 +RT | 30.81 | 20.4 | -51.029% |
| Cyberpunk2077 +RT+DLSS3/FSR Performance | 83.31 | 56.39 | -47.739% |
| Tom Clancy’s The Division 2 | 115 | 112 | -2.679% |
| Metro Exodus | 104.33 | 100.08 | -4.247% |
| Metro Exodus(RT_high) | 74.93 | 58.26 | -28.613% |
| F1 22 | 162 | 196 | 17.347% |
| F1 22 (Ray Tracing_Ultra_high) | 61 | 55 | -10.909% |
| F1 22 (Ray Tracing+DLSS_Quality) | 100 | 113 | 11.504% |
| Far Cry 6 | 110 | 123 | 10.569% |
| Far Cry 6 (RT) | 96 | 104 | 7.692% |
| Forza Horzion 5 (Extreme/RT off) | 121 | 118 | -2.542% |
| Forza Horzion 5 (Extreme/RT ON) | 112 | 105 | -6.667% |
| Horizon Zero Dawn | 117 | 117 | 0.000% |
| Rainbow Six Siege | 410 | 397 | -3.275% |
| Shadow of the Tomb Raider (highest) | 134 | 129 | -3.876% |
| Shadow of the Tomb Raider (RT) | 88 | 77 | -14.286% |
| SpiderMan Miles Moral (Very High) | 103.4 | 88.7 | -16.573% |
| SpiderMan Miles Moral (Very High + RT) | 49.7 | 36 | -187.222% |
| SpiderMan Miles Moral (Very High + RT+ DLSS/FSR Perf) | 109.8 | 75.6 | 34.259% |
| Total War: Troy | 118.7 | 134 | 18.060% |
| WarHammer Darktide(High) | 65.7 | 65.7 | -80.670% |
| Watch Dog Legion | 87 | 96 | 31.563% |
| Watch Dog Legion(RT_Ultra) | 46 | 39 | -123.077% |
最後的遊戲測試則是在 2K 解析度下進行,這可能也是大部分使用此級別顯示卡玩家會選擇的解析度。
Radeon RX 7900 XTX vs Radeon RX 6950 XT:
| 2K Gaming | Radeon RX 6950 XT | Radeon RX 7900 XTX | |
|---|---|---|---|
| Assassin Creed Vahalla | 136 | 167 | 18.563% |
| Borderlands 3 : bad ass | 140.05 | 201.5 | 30.496% |
| Cyberpunk2077 | 75.57 | 133.86 | 43.545% |
| Cyberpunk2077 +RT | 28.05 | 41.53 | 32.458% |
| Cyberpunk2077 +RT+DLSS3/FSR Performance | 75.44 | 92.51 | 18.452% |
| Tom Clancy’s The Division 2 | 150 | 203 | 26.108% |
| Metro Exodus | 118.15 | 152.49 | 22.520% |
| Metro Exodus(RT_high) | 77.47 | 105.99 | 26.908% |
| F1 22 | 251 | 271 | 7.380% |
| F1 22 (Ray Tracing_Ultra_high) | 73 | 104 | 29.808% |
| F1 22 (Ray Tracing+DLSS_Quality) | 144 | 166 | 13.253% |
| Far Cry 6 | 142 | 159 | 10.692% |
| Far Cry 6 (RT) | 119 | 130 | 8.462% |
| Forza Horzion 5 (Extreme/RT off) | 142 | 150 | 5.333% |
| Forza Horzion 5 (Extreme/RT ON) | 127 | 135 | 5.926% |
| Horizon Zero Dawn | 175 | 202 | 13.366% |
| Rainbow Six Siege | 595 | 710 | 16.197% |
| Shadow of the Tomb Raider (highest) | 181 | 233 | 22.318% |
| Shadow of the Tomb Raider (RT) | 102 | 142 | 28.169% |
| SpiderMan Miles Moral (Very High) | 92.4 | 123 | 24.878% |
| SpiderMan Miles Moral (Very High + RT) | 45 | 64 | 29.688% |
| Total War: Troy | 186 | 234.7 | 20.750% |
| WarHammer Darktide(High) | 91 | 134.5 | 32.342% |
| Watch Dog Legion | 110 | 146 | 24.658% |
| Watch Dog Legion(RT_Ultra) | 50 | 74 | 32.432% |
Radeon RX 7900 XT vs Radeon RX 6950 XT:
| 2K Gaming | Radeon RX 6950 XT | Radeon RX 7900 XT | |
|---|---|---|---|
| Assassin Creed Vahalla | 136 | 150 | 9.333% |
| Borderlands 3 : bad ass | 140.05 | 165.23 | 15.239% |
| Cyberpunk2077 | 75.57 | 116.76 | 35.277% |
| Cyberpunk2077 +RT | 28.05 | 35.56 | 21.119% |
| Cyberpunk2077 +RT+DLSS3/FSR Performance | 75.44 | 83.14 | 9.261% |
| Tom Clancy’s The Division 2 | 150 | 175 | 14.286% |
| Metro Exodus | 118.15 | 122.67 | 3.685% |
| Metro Exodus(RT_high) | 77.47 | 87.35 | 11.311% |
| F1 22 | 251 | 257 | 2.335% |
| F1 22 (Ray Tracing_Ultra_high) | 73 | 91 | 19.780% |
| F1 22 (Ray Tracing+DLSS_Quality) | 144 | 158 | 8.861% |
| Far Cry 6 | 142 | 162 | 12.346% |
| Far Cry 6 (RT) | 119 | 140 | 15.000% |
| Forza Horzion 5 (Extreme/RT off) | 142 | 135 | -5.185% |
| Forza Horzion 5 (Extreme/RT ON) | 127 | 123 | -3.252% |
| Horizon Zero Dawn | 175 | 180 | 2.778% |
| Rainbow Six Siege | 595 | 625 | 4.800% |
| Shadow of the Tomb Raider (highest) | 181 | 205 | 11.707% |
| Shadow of the Tomb Raider (RT) | 102 | 123 | 17.073% |
| SpiderMan Miles Moral (Very High) | 92.4 | 111.4 | 17.056% |
| SpiderMan Miles Moral (Very High + RT) | 45 | 50 | 10.000% |
| Total War: Troy | 186 | 208.6 | 10.834% |
| WarHammer Darktide(High) | 91 | 107.4 | 15.270% |
| Watch Dog Legion | 110 | 136 | 19.118% |
| Watch Dog Legion(RT_Ultra) | 50 | 65 | 23.077% |
Radeon RX 7900 XTX vs GeForce RTX 4080:
| 2K Gaming | GeForce RTX 4080 | Radeon RX 7900 XTX | |
|---|---|---|---|
| Assassin Creed Vahalla | 153 | 167 | 8.383% |
| Borderlands 3 : bad ass | 168.9 | 201.5 | 16.179% |
| Cyberpunk2077 | 132.69 | 133.86 | 0.874% |
| Cyberpunk2077 +RT | 63.15 | 41.53 | -52.059% |
| Cyberpunk2077 +RT+DLSS3/FSR Performance | 132.46 | 92.51 | -43.185% |
| Tom Clancy’s The Division 2 | 215 | 203 | -5.911% |
| Metro Exodus | 153.8 | 152.49 | -0.859% |
| Metro Exodus(RT_high) | 125.28 | 105.99 | -18.200% |
| F1 22 | 231 | 271 | 14.760% |
| F1 22 (Ray Tracing_Ultra_high) | 112 | 104 | -7.692% |
| F1 22 (Ray Tracing+DLSS_Quality) | 157 | 166 | 5.422% |
| Far Cry 6 | 154 | 159 | 3.145% |
| Far Cry 6 (RT) | 121 | 130 | 6.923% |
| Forza Horzion 5 (Extreme/RT off) | 157 | 150 | -4.667% |
| Forza Horzion 5 (Extreme/RT ON) | 146 | 135 | -8.148% |
| Horizon Zero Dawn | 201 | 202 | 0.495% |
| Rainbow Six Siege | 704 | 710 | 0.845% |
| Shadow of the Tomb Raider (highest) | 240 | 233 | -3.004% |
| Shadow of the Tomb Raider (RT) | 165 | 142 | -16.197% |
| SpiderMan Miles Moral (Very High) | 158 | 123 | -28.455% |
| SpiderMan Miles Moral (Very High + RT) | 90.8 | 64 | -41.875% |
| Total War: Troy | 203.1 | 234.7 | 13.464% |
| WarHammer Darktide(High) | 125.2 | 134.5 | 6.914% |
| Watch Dog Legion | 132 | 146 | 9.589% |
| Watch Dog Legion(RT_Ultra) | 85 | 74 | -14.865% |
Radeon RX 7900 XT vs GeForce RTX 4080:
| 2K Gaming | GeForce RTX 4080 | Radeon RX 7900 XT | |
|---|---|---|---|
| Assassin Creed Vahalla | 153 | 150 | -2.000% |
| Borderlands 3 : bad ass | 168.9 | 165.23 | -2.221% |
| Cyberpunk2077 | 132.69 | 116.76 | -13.643% |
| Cyberpunk2077 +RT | 63.15 | 35.56 | -77.587% |
| Cyberpunk2077 +RT+DLSS3/FSR Performance | 132.46 | 83.14 | -59.322% |
| Tom Clancy’s The Division 2 | 215 | 175 | -22.857% |
| Metro Exodus | 153.8 | 122.67 | -25.377% |
| Metro Exodus(RT_high) | 125.28 | 87.35 | -43.423% |
| F1 22 | 231 | 257 | 10.117% |
| F1 22 (Ray Tracing_Ultra_high) | 112 | 91 | -23.077% |
| F1 22 (Ray Tracing+DLSS_Quality) | 157 | 158 | 0.633% |
| Far Cry 6 | 154 | 162 | 4.938% |
| Far Cry 6 (RT) | 121 | 140 | 13.571% |
| Forza Horzion 5 (Extreme/RT off) | 157 | 135 | -16.296% |
| Forza Horzion 5 (Extreme/RT ON) | 146 | 123 | -18.699% |
| Horizon Zero Dawn | 201 | 180 | -11.667% |
| Rainbow Six Siege | 704 | 625 | -12.640% |
| Shadow of the Tomb Raider (highest) | 240 | 205 | -17.073% |
| Shadow of the Tomb Raider (RT) | 165 | 123 | -34.146% |
| SpiderMan Miles Moral (Very High) | 158 | 111.4 | -41.831% |
| SpiderMan Miles Moral (Very High + RT) | 90.8 | 50 | -81.600% |
| Total War: Troy | 203.1 | 208.6 | 2.637% |
| WarHammer Darktide(High) | 125.2 | 107.4 | -16.574% |
| Watch Dog Legion | 132 | 136 | 2.941% |
| Watch Dog Legion(RT_Ultra) | 85 | 65 | -30.769% |
Radeon RX 7900 XTX vs Radeon RX 7900 XT:
| 2K Gaming | Radeon RX 7900 XT | Radeon RX 7900 XTX | |
|---|---|---|---|
| Assassin Creed Vahalla | 150 | 167 | 10.180% |
| Borderlands 3 : bad ass | 165.23 | 201.5 | 18.000% |
| Cyberpunk2077 | 116.76 | 133.86 | 12.775% |
| Cyberpunk2077 +RT | 35.56 | 41.53 | 14.375% |
| Cyberpunk2077 +RT+DLSS3/FSR Performance | 83.14 | 92.51 | 10.129% |
| Tom Clancy’s The Division 2 | 175 | 203 | 13.793% |
| Metro Exodus | 122.67 | 152.49 | 19.555% |
| Metro Exodus(RT_high) | 87.35 | 105.99 | 17.587% |
| F1 22 | 257 | 271 | 5.166% |
| F1 22 (Ray Tracing_Ultra_high) | 91 | 104 | 12.500% |
| F1 22 (Ray Tracing+DLSS_Quality) | 158 | 166 | 4.819% |
| Far Cry 6 | 162 | 159 | -1.887% |
| Far Cry 6 (RT) | 140 | 130 | -7.692% |
| Forza Horzion 5 (Extreme/RT off) | 135 | 150 | 10.000% |
| Forza Horzion 5 (Extreme/RT ON) | 123 | 135 | 8.889% |
| Horizon Zero Dawn | 180 | 202 | 10.891% |
| Rainbow Six Siege | 625 | 710 | 11.972% |
| Shadow of the Tomb Raider (highest) | 205 | 233 | 12.017% |
| Shadow of the Tomb Raider (RT) | 123 | 142 | 13.380% |
| SpiderMan Miles Moral (Very High) | 111.4 | 123 | 9.431% |
| SpiderMan Miles Moral (Very High + RT) | 50 | 64 | 21.875% |
| Total War: Troy | 208.6 | 234.7 | 11.121% |
| WarHammer Darktide(High) | 107.4 | 134.5 | 20.149% |
| Watch Dog Legion | 136 | 146 | 6.849% |
| Watch Dog Legion(RT_Ultra) | 65 | 74 | 12.162% |
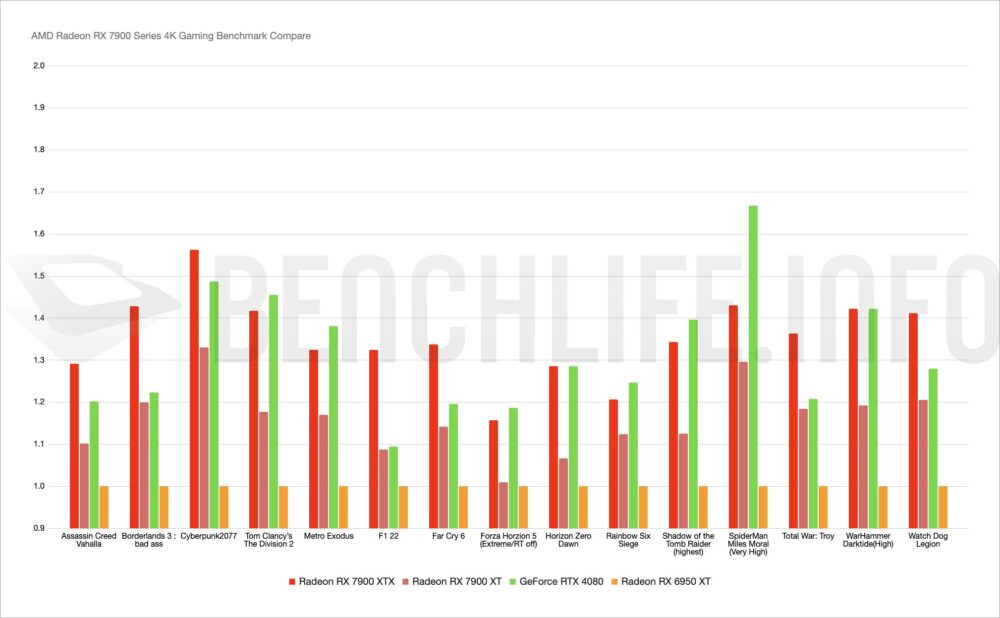
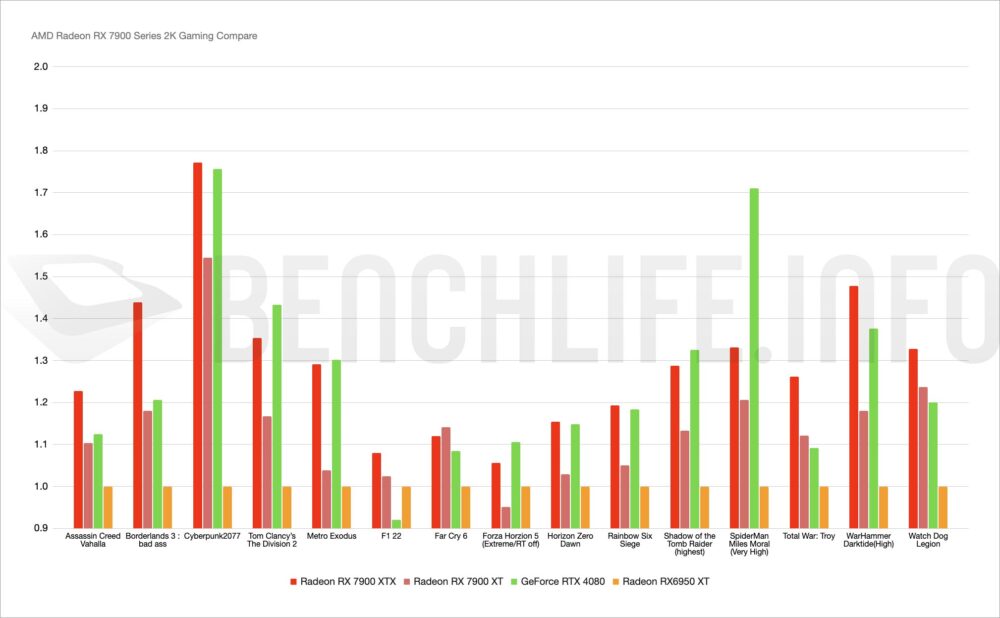
針對 Radeon RX 7900 XTX、Radeon RX 7900 XT、Radeon RX 6950 XT 與 NVIDIA GeForce RTX 4080 在 3DMark、4K Gaming、4K Gaming with RT、2K Gaming 與 2K Gaming with RT 的數據比較,這裡彙整了 5 張曲線圖提供參考。
曲線圖部分,是以 Radeon RX 6950 XT 為基準點去設定。
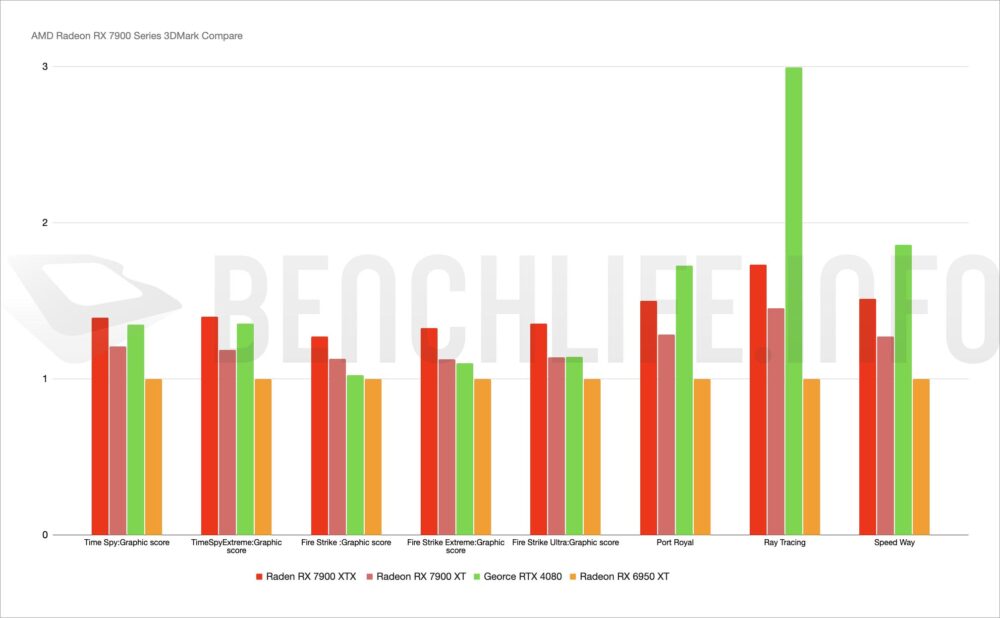
3DMark 部分,不難發現 Radeon RX 7900 XTX 在 Time Spy 與 FireStrike 系列都領先 GeForce RTX 4080,但是在 Port Royal、Speed Way 與 Ray Tracing 部分都落後於 GeForce RTX 4080。
4K 遊戲方面,Radeon RX 7900 XTX 在我們測試的遊戲項目內,有著一定優勢,不過 GeForce RTX 4080 則是在 Tom Clancy‘s The Division 2、Forza Horizon 5、Rainbox Six Siege、Shadow of the Tomb Raider 和 SpiderMan Miles Moral 領先 Radeon RX 7900 XTX。
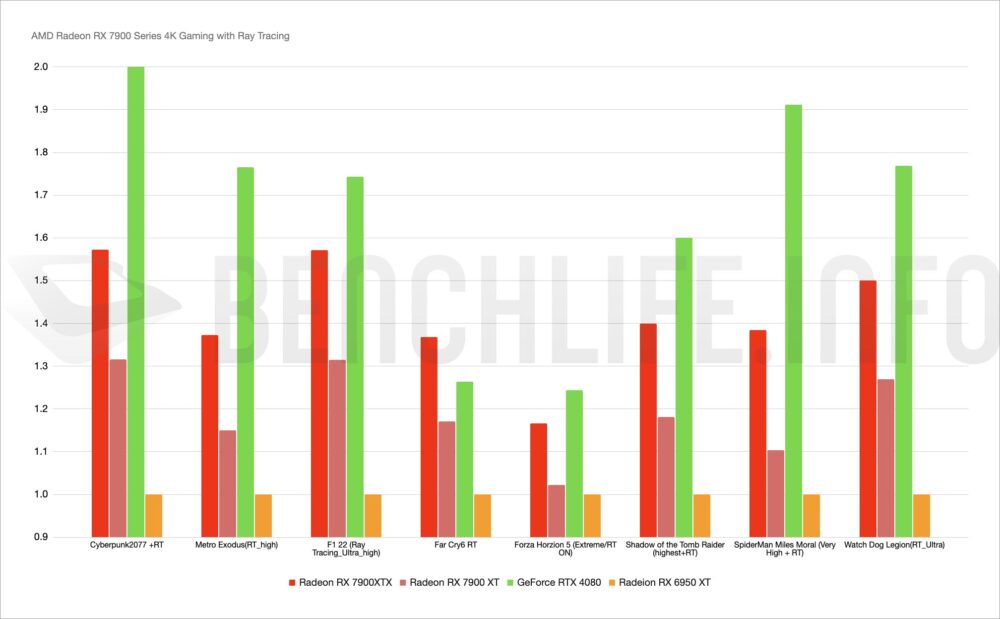
開啟 RT 的 4K 遊戲部分,Radeon RX 7900 XT 除了在 Far Cry 6 佔有一些優勢外,其他遊戲基本上都是 GeForce RTX 4080 的天下。
至於 2K 遊戲的話,我們遊戲測試項目共計 15 款,AMD Radeon RX 7900 XTX 領先 NVIDIA GeForce RTX 4080 有 11 款之多。
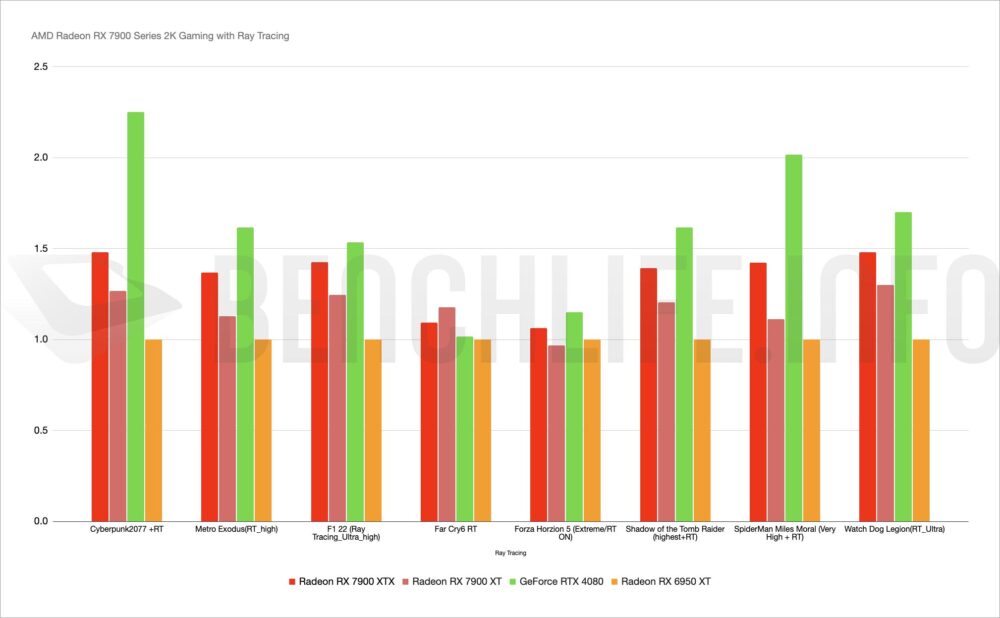
2K 解析度下開啟 RT 進行測試,AMD Radeon RX 7900 XTX 也只有在 Far Cry 6 一款遊戲領先 GeForce RTX 4080,這部分與 4K 解析度相同。大家,也可能注意到 Far Cry 6 遊戲下,AMD Radeon RX 7900 XT 的表現要比 Radeon RX 7900 XTX 佳,這部分可能是因為 CPU BOUND 的關係。
跟著來看看 Radeon RX 7900 XTX 與 Radeon RX 7900 XT 的待機、Furmark 與 F1 22 的功耗表現。
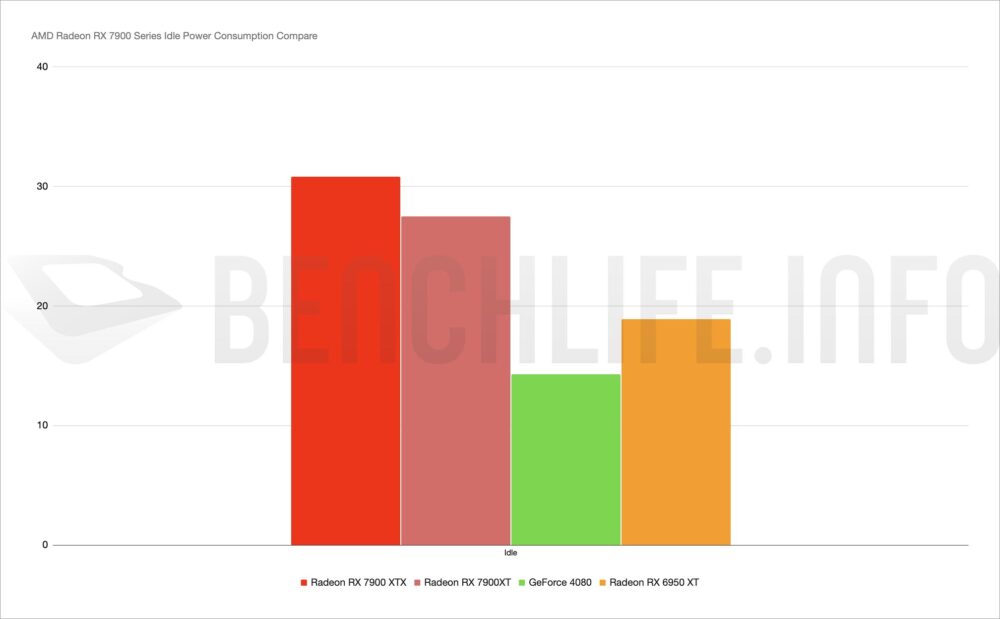
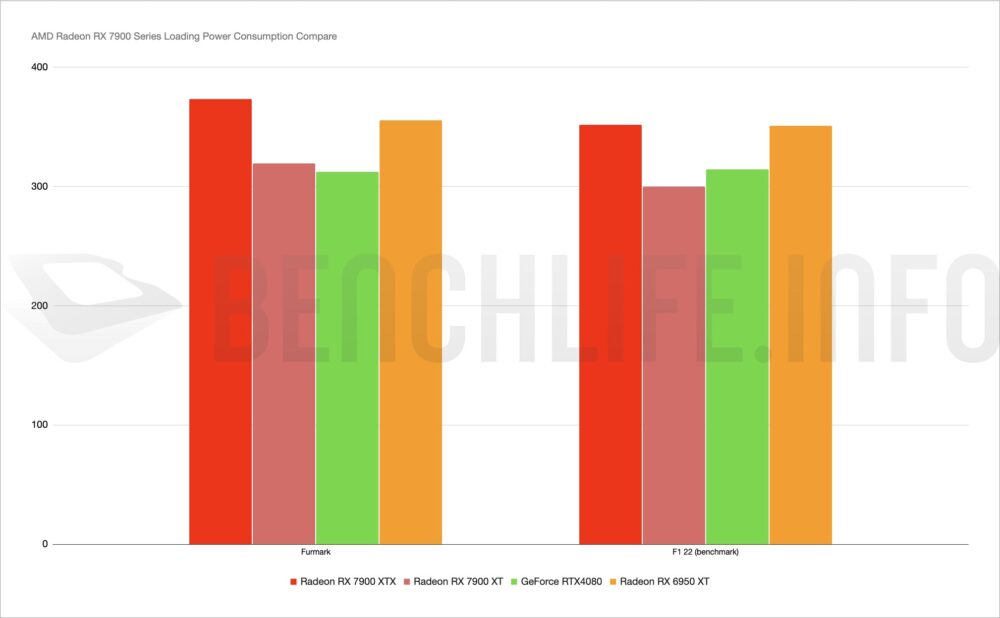
Radeon RX 7900 XTX 在 Furmark 條件下,TBP 平均可以達到 373.4W,至於 Radeon RX 7900 XT 則是 319.4W,這些數據都高於 AMD 官方提出的 355W 與 315W。
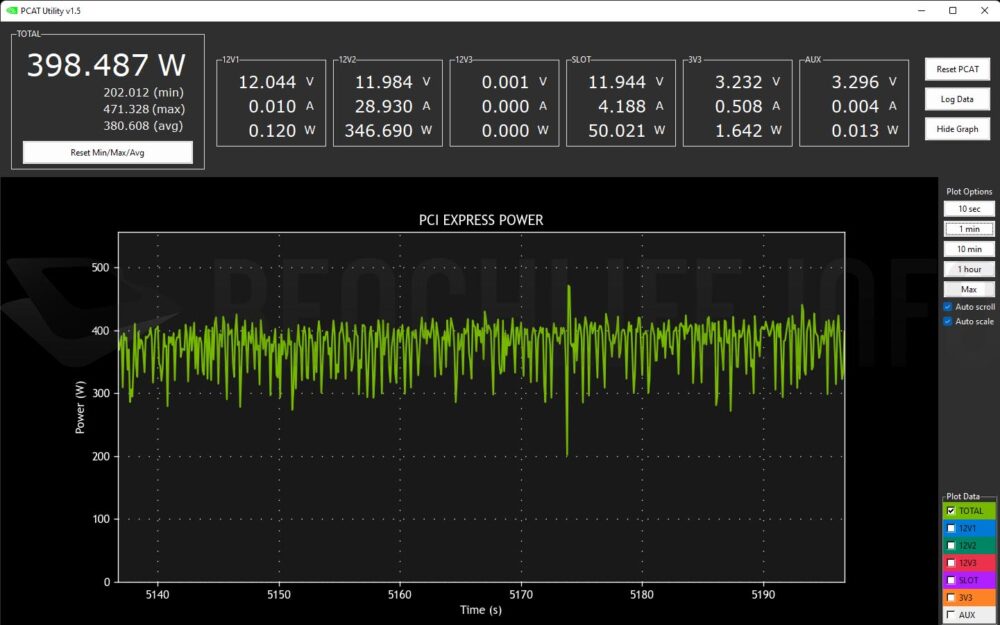
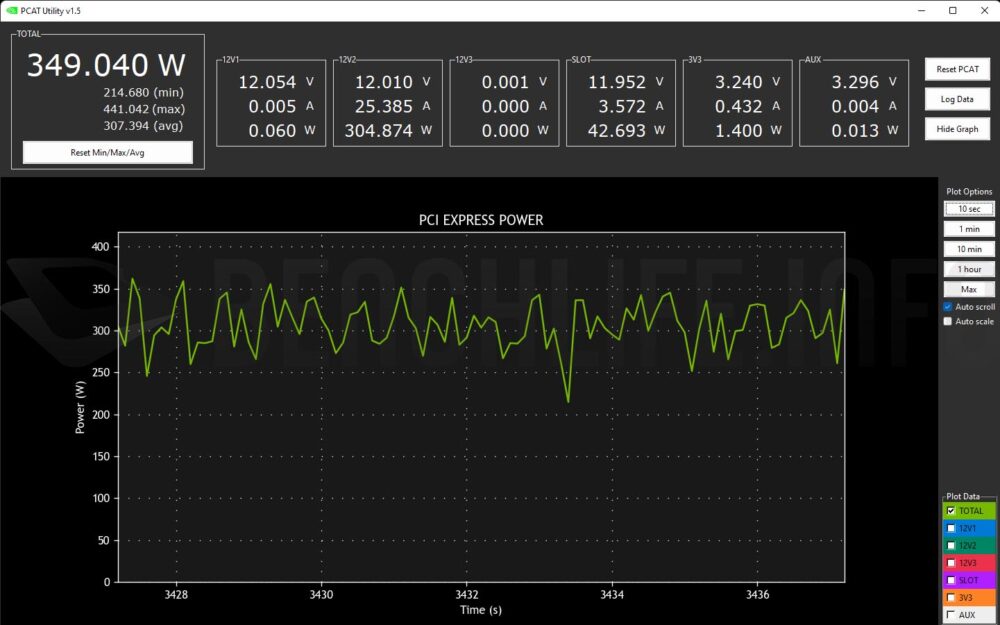
至於透過 NVIDIA PCAT 工具,Radeon RX 7900 XTX 與 Radeon RX 7900 XT 瞬間最大功耗分別可以來到 398W 與 349W.
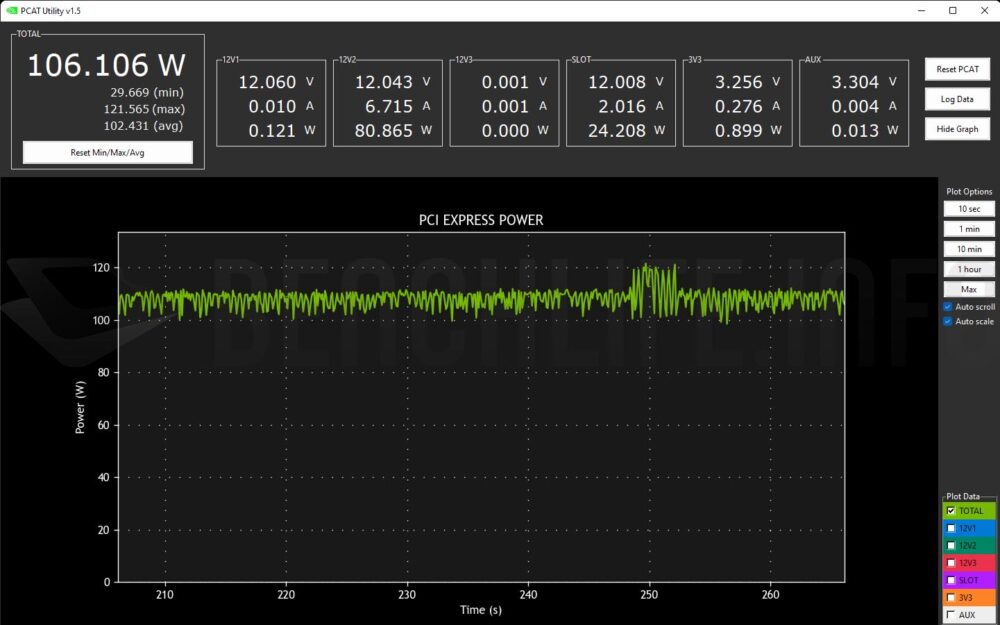
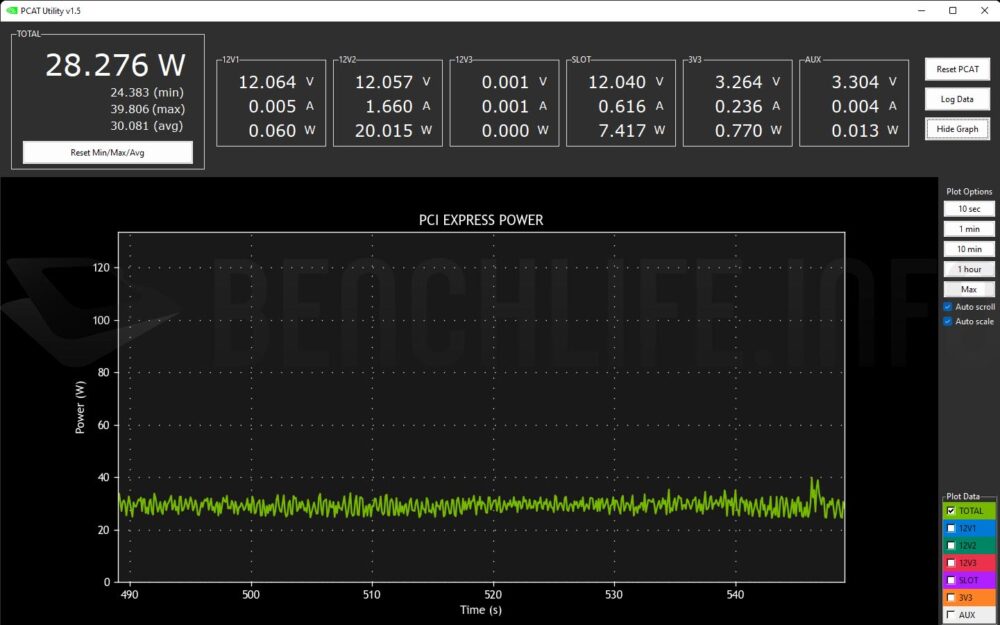
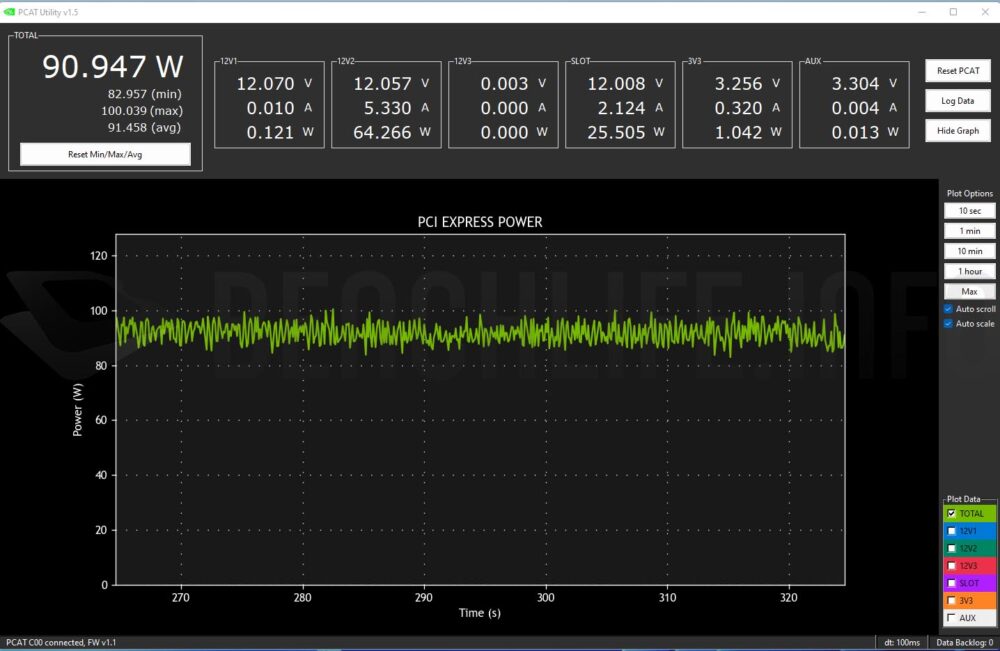
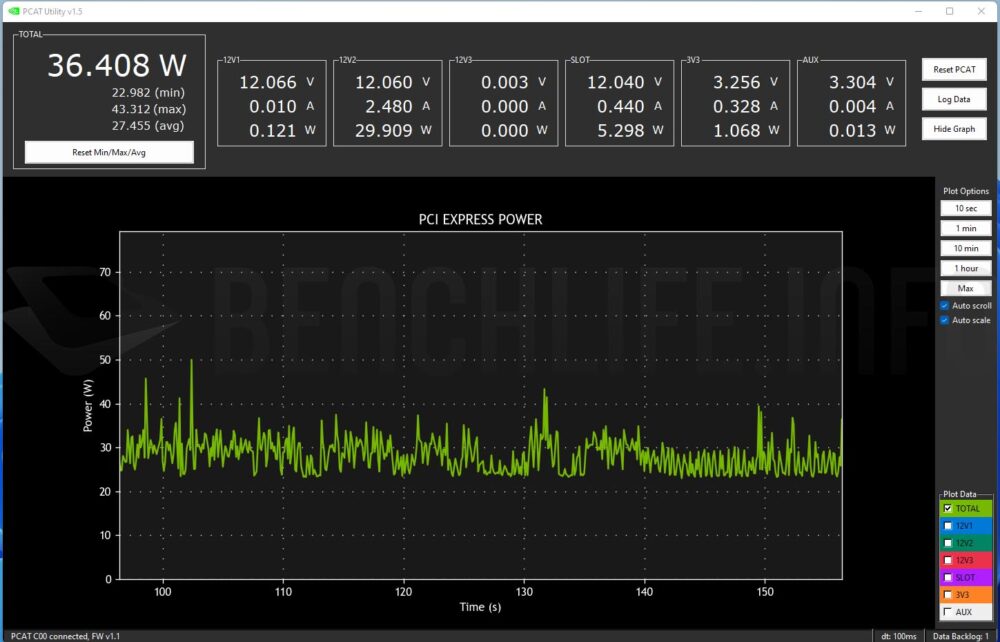
在測試中,我們也發現了一個有趣的現象,也許用 BUG 稱之會更合適。Radeon RX 7900 系列顯示卡在 HDMI 2.1 條件下的待機功耗約在 30W 左右,但在使用 DisplayPort 的條件下,顯示卡的待機功耗則會突破 90 – 100W。
Radeon RX 7900 XTX with DisplayPort:
Radeon RX 7900 XTX with HDMI:
Radeon RX 7900 XT with DisplayPort:
Radeon RX 7900 XT with HDMI:
也許是顯示卡驅動尚未優化完成,希望 AMD 在未來的驅動更新可以將此問題解決。
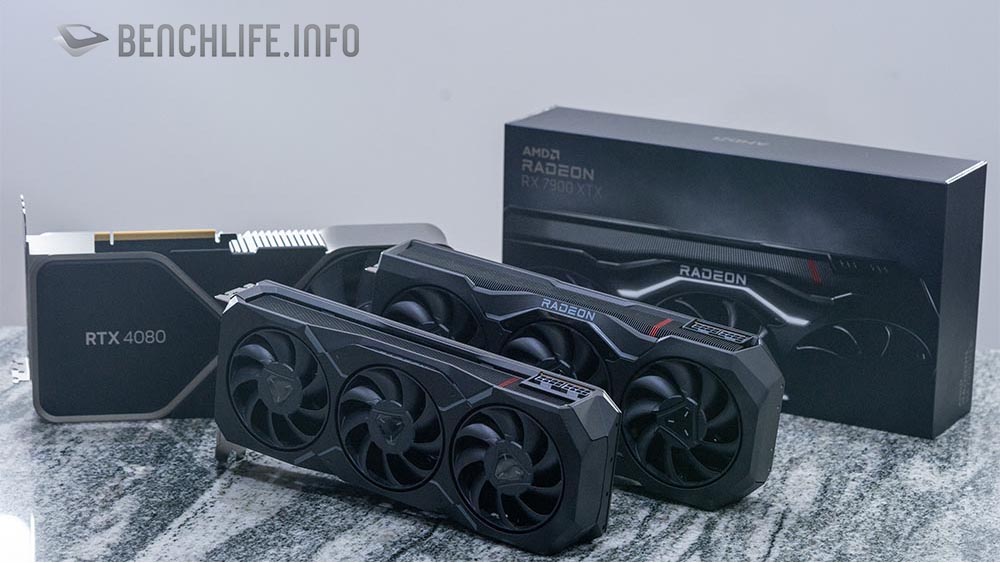
無法與 Ada Lovelace 架構的旗艦產品 GeForce RTX 4090 抗衡,但給予 NVIDIA GeForce RTX 家族最多人選擇的高階卡一些壓力,對於整個市場是一件好事,特別是大家都覺得 NVIDIA 這次在 GeForce RTX 4080 的訂價偏高許多。
面對採用 Chiplet 設計的 RDNA 3 架構,NVIDIA GeForce RTX 4080 在部分遊戲是明顯落後 Radeon RX 7900 XTX,這也許會讓 NVIDIA 開始思考調整 GeForce RTX 4080 的售價,只是到目前為止都只是市場傳聞,NVIDIA 若真如此做,那就真的打破過往調整售價的步伐。
至於 Ray Tracing 部分,採用 RDNA 3 架構的 AMD Radeon RX 7900 系列確實有強化,但與 Ada Lovelace 架構相比較的話,很明顯還是落後不少,AMD 在這部分還有很大的努力空間。
另一方面,USB-C 的加入以及 DisplayPort 2.1 都算是一個相當不錯的加分功能。
Radeon RX 7900 XTX 確實與 GeForce RTX 4080 有著相當不錯的抗衡,不過功耗部分可能是一個弱點;至於 Radeon RX 7900 XT 要與 GeForce RTX 4070 Ti 或是 GeForce RTX 4070 比較後才能了解其定位是否正確。
不過以 899 美元的訂價,Radeon RX 7900 XT 效能應該與 GeForce RTX 4070 Ti 相差不大。
整體而言,RDNA 3 架構的 AMD Radeon RX 7900 XTX 表現讓我們覺得相當具有優勢,至於 Radeon RX 7900 XT 我們先保留到 GeForce RTX 4070 Ti 出來後再下結論。
