第一篇,我們先來看看 Intel Core Ultra 285K 的測試。
掙脫 Raptor Lake 系列處理器 Vmin Shift 的困擾,迎來全新的 Lunar Lake 與 Arrow Lake 世代的 Intel Core Ultra 2 系列處理器,對於這家 x86 處理器架構龍頭來說,或許是一個全新的開始。
Lunar Lake,Intel Core Ultra 200V 在筆記型電腦部分有著相當不錯的續航力,以及效能表現。
Arrow Lake,Intel Core Ultra 200S 在桌上型電腦用處理器市場,究竟帶來什麼樣的新花樣,以及其效能到底是否能滿足使用者的日常,我們會在這一篇文章中陸續介紹。
就如當年從「Core 2」轉入「Core i」般,「Core Ultra」對 Intel 是一個新的開局;第一代 Core Ultra 代號為 Meteor Lake,就是那個差一點出現在桌上型電腦用處理器的 Meteor Lake。
![]()
![]()
![]()
![]()
捨棄使用許久的 Hyper Threading 技術,採用 LGA 1851 腳位,搭配 Intel 800 系列晶片,整合 Thunderbolt 4,全面轉入 DDR5 世代記憶體,以及整合 Alchemist 架構 GPU 和 NPU,相對於過去,代號 Arrow Lake 的系列處理器是 Intel 接下來的新未來。
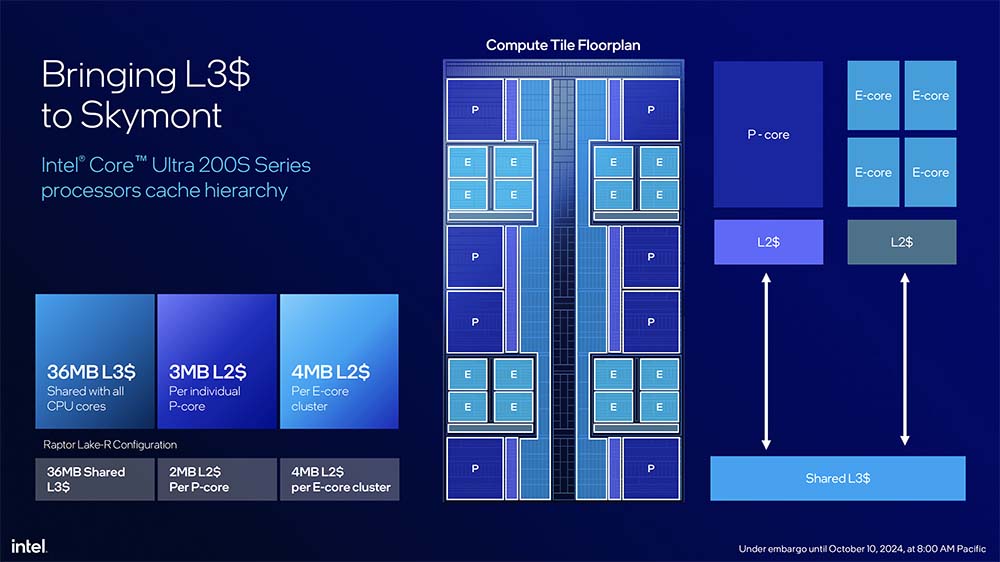
Arrow Lake-S 是由好幾個 Tile 組成,這裡面包含 I/O、Filler、Base、GPU、SOC 以及最重要的 Compute Tile。
Compute Tile 裡面是 P-Cores 與 E-Cores。
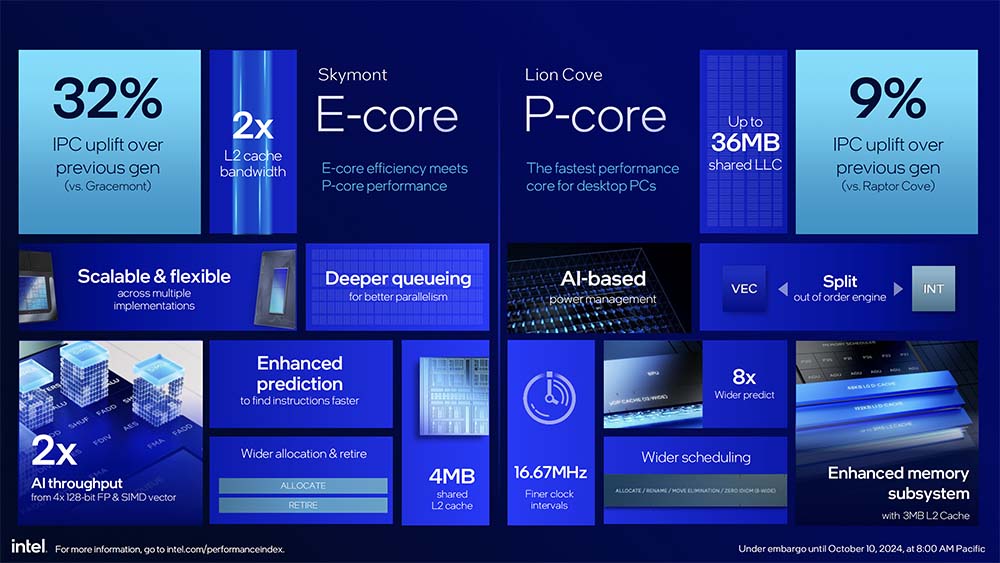
P-Cores,也就是 Performance Cores 採用的是 Lion Cove 處理器架構,現階段最高為 8 核心配置;E-Cores 為 Efficient Cores,使用的是 Skymont 處理器架構,最高為 16 核心配置。
結合起來,P-Cores + E-Cores 最高可以提供 24 核心處理器配置,這也就是目前最高階的 Intel Core Ultra 9 285K 處理器。
Skymont 處理器架構,與 Gracemont 相比較的話,IPC 有著 32% 的提升。除此以外,L2 Cache 頻寬則是有 2x 提升,並擁有 4MB 的共享 L2 Cache 配置(Per E-Core Cluster)。
至於 Raptor Cove 的接替者,也就是 Lion Cove 處理器架構在 IPC 部分則有著 9% 提升,另還有高達 36MB Cache 配置,以及強化記憶體子系統(memory subsystem)的 3MB L2 Cache 配置。
其實,更重要的部分在於 Intel 首度在 E-Cores 加入 L3 Cache 配置。
P-Cores 與 E-Cores 擁有各自的 L2 Cache 配置,但高達 36MB 配置的 L3 Cache 可以讓 P-Cores 和 E-Cores 共享。
Compute Tile 沒太難理解的部分,至於 GPU Tile 就更好理解,因為它就是代號 Alchemist 的 Xe GPU 架構。
Intel Core Ultra 200S 系列處理器的 Xe-LPG GPU 最高擁有 4 Xe-Cores、Ray Tracing Units 與 L2 Cache 配置。全面支援 DirectX 12 Ultimate、XeSS 並擁有 Xe Media Engine 支援 Encode 與 Decode,如果與過去 Intel 處理器內的 iGPU 相比較的話,Arrow Lake 所使用的 Xe GPU 架構有著全面性的提升,但與 Lunar Lake 的 Xe2 GPU 架構比較的話,就遜色了不少。
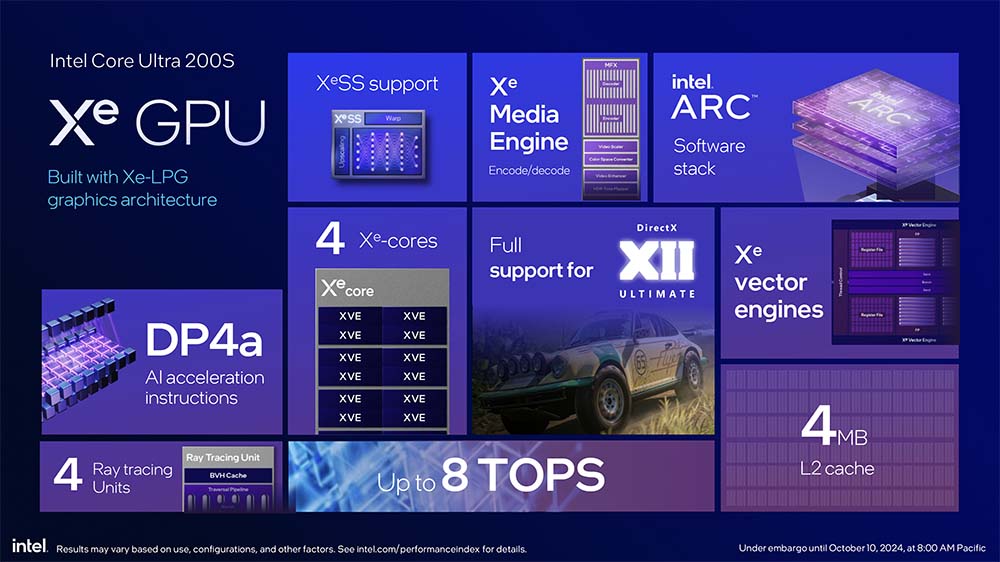
畢竟,Lunar Lake 的 Xe2 GPU 架構是代號 Battlemage 的第二代 Intel Arc GPU。
SOC Tile 部分是 NPU 3 架構,主要負責 AI 運算。
Intel Core Ultra 200S 以 Compute + GPU + SOC Tile 來計算的話,平台最高可以提供 36 TOPS 表現(INT8)。
分開來看的話,Intel Core Ultra 200S 的 Compute Tile 最高為 15 TOPS,而 SOC 與 GPU Tile 最高分別是 13 和 8 TOPS,類似的 TOPS 表現與 Meteor Lake 是接近,但仍舊落後於 Lunar Lake 的 120 TOPS 表現。
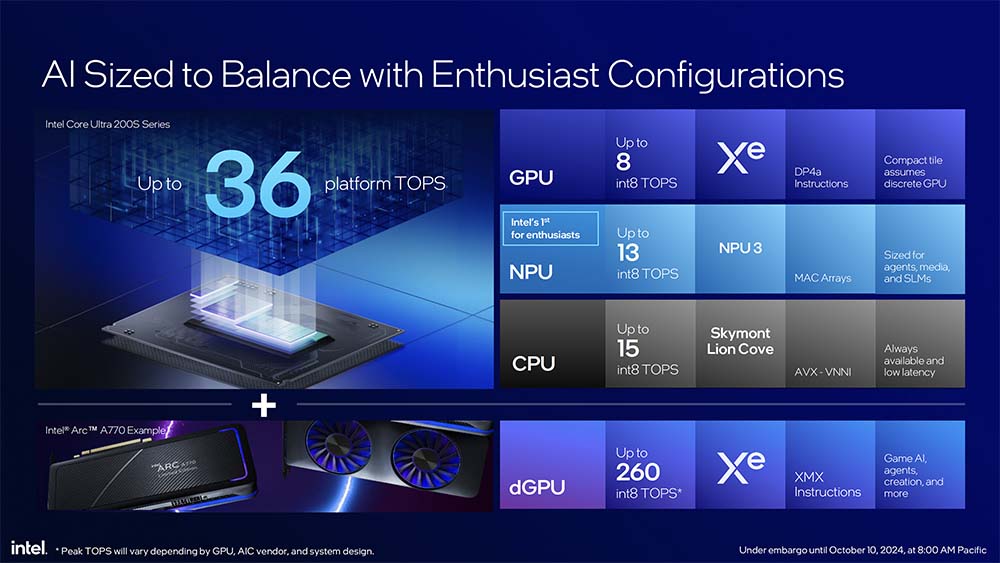
使用 NPU 4 架構,Lunar Lake 的 Intel Core Ultra 200V 系列處理器單單 SOC Tile 就能提供 45 TOPS 的能耐。
介紹了那麼多,其實在過去的報導中都陸續有提到相關的規格,現在,也就是 10 月 24 日晚間,Intel Core Ultra 200S 系列處理器中的「K」與「KF」處理器正式登場。
當然,這也就意味著我們要看看多款處理器的效能表現,包含旗艦的 Intel Core Ultra 9 285K(295K 沒有在 Intel Roadmap 中出現過)、Intel Core Ultra 7 265K 與 Intel Core Ultra 5 245K 等 3 款處理器的實際表現。
官方提供的測試樣品為 Intel Core Ultra 9 285K 與 Intel Core Ultra 5 245K,但為提供最完整的 Intel Core Ultra 200S 測試,我們商借了 Intel Core Ultra 7 265K 進行測試,讓大家對 Arrow Lake-S 有著進一步的了解。
![]()
記得,「KF」因為沒有 iGPU,因此會少了 8 TOPS 表現。
Intel Core Ultra 9 285K 作為旗艦處理器,擁有 8P + 16E 共計 24C24T 配置,最高核心時脈可以達到 5.7GHz,低於 Intel Core i9-14900K 的 6.0GHz,但核心時脈已經不是 Arrow Lake 世代處理器的重心。
Intel Core Ultra 7 265K 擁有 8P + 12E 共計 20C20T 配置,最高時脈可以達到 5.5GHz。
Intel Core Ultra 5 245K 為 6P + 12E 共計 18C18T 配置,最高時脈則是 5.2GHz。
以上 3 款處理器皆配置了 4 Xe GPU Cores,提供 8 TOPS 運算能力。
3 款 Intel Core Ultra 處理器,搭配上 3 款 14th Gen 與 3 款 AMD Ryzen 9000 系列處理器,所以測試數據會較為龐大,迫使我們要分成 3 篇文章來完整呈現:
1. Intel Core Ultra 9 285K,我們會與 Intel Core i9-14900K 和 AMD Ryzen 9 9950X 進行測試比較;
延伸閱讀 – Arrow Lake- S 世代的 Intel Core Ultra 9 285K 實測
2. Intel Core Ultra 7 265K 則會與 Intel Core i7-14700K 和 AMD Ryzen 9 9900X 比較;
延伸閱讀 – Arrow Lake- S 世代的 Intel Core Ultra 7 265K 實測
3. 最後,是 Intel Core Ultra 5 245K,這顆處理器會與 Intel Core i5-14600K 和 AMD Ryzen 7 9700X 進行比較。
前面提到 Intel Core Ultra 9 285K 是一顆 8 P-Cores + 16 E-Cores,共計 24C24T 配置的處理器;基本時脈分別是 P-Cores 的 3.7GHz 與 E-Cores 的 3.2GHz,而最高時脈(Intel Thermal Velocity)為 5.7GHz,另外還有 Intel Turbo Boost Max 3.0 的 5.5GHz。以及 P-Cores 最高的 5.5GHz 和 E-Cores 最高的 4.6GHz Max Turbo Frequency。
Intel Core Ultra 285K 的 Total L2 Cache 為 40MB,以及擁有 36MB Intel Smart Cache(L3)。
Processor Base Power 為 125W,但 Intel Core Ultra 9 285K 的 Maximum Turbo Power 達到 250W。
Intel Core Ultra 200S 的 Arrow Lake 世代開始支援 DDR5-6400 MT/s 原生時脈的記憶體顆粒,Raptor Lake 部分為 DDR-5600 MT/s。
Intel Core Ultra 9 285K Spec
| Intel Core Ultra 9 285K | Intel Core i9-14900K | AMD Ryzen 9 9950X | |
| Cores | 24(8 + 16) | 24(8 + 16) | 16 |
| Threads | 24 | 32 | 32 |
| L2 Cache | 40MB | 32MB | 16MB |
| Intel Smart Cache (L3) | 36MB | 36MB | 64MB |
| P-Cores Frequency (Base) | 3.7GHz | 3.2GHz | 4.3GHz |
| E-Cores Frequency (Base) | 3.2GHz | 2.4GHz | - |
| P-Cores Max Turbo Frequency | Up to 5.5GHz | Up to 5.6GHz | 5.7GHz |
| E-Cores Max Turbo Frequency | Up to 4.6GHz | Up to 4.4GHz | - |
| Thermal Velocity Boost | Up to 5.7GHz | Up to 6.0GHz | - |
| Turbo Boost Max Technology 3.0 | Up to 5.6GHz | Up to 5.8GHz | - |
| Memory | DDR5-6400 MT/s | DDR5-5600 MT/s; DDR4-3200 MT/s; | DDR5-5600 MT/s |
| Processor Base Power | 125W | 125W | 170W |
| Maximum Turbo Power | 250W | 253W | - |
先看看與 Intel Core i9-14900K 的測試數據比較:
3DMark - Intel Core i9-14900K
| 3DMark | Intel Core i9-14900K | Intel Core Ultra 9 285K | |
| TIme Spy | 33004 | 32094 | -2.835% |
| Graphic score | 36392 | 36663 | 0.739% |
| CPU score | 21606 | 18812 | -14.852% |
| TIme Spy Extreme | 17057 | 18044 | 5.470% |
| Graphic score | 18973 | 18933 | -0.211% |
| CPU score | 10851 | 14210 | 23.638% |
| Fire Strike | 45891 | 45544 | -0.762% |
| Graphic score | 64398 | 62273 | -3.412% |
| Physics score | 49655 | 49455 | -0.404% |
| Combo score | 14038 | 14535 | 3.419% |
| Fire Strike Ultra | 24213 | 24453 | 0.981% |
| Graphic score | 24400 | 24287 | -0.465% |
| Physics score | 49664 | 55125 | 9.907% |
| Combo score | 13260 | 13713 | 3.303% |
| Night Raid | 94757 | 105140 | 9.875% |
| Graphic score | 249190 | 241256 | -3.289% |
| CPU score | 21002 | 25037 | 16.116% |
3DMark 部分可以見到 2 款處理器表現不相上下,只是 Time Spy 與 Time Spy Extreme CPU Score 差距有點大,其餘 3 個項目都是 Intel Core Ultra 9 285K 有著領先。
1080p Gaming - Intel Core i9-14900K
| 1080P Gaming | Intel Core i9-14900K | Intel Core Ultra 9 285K | |
| Borderlands 3(Ultra) | 275.81 | 273.08 | -1.000% |
| Counter-Strike 2 | 552.9 | 610.4 | 9.420% |
| Cyberpunk 2077(Ultra) | 205.29 | 186.78 | -9.910% |
| Dirt 5 | 293.1 | 324.4 | 9.649% |
| F1 23(High) | 298 | 309 | 3.560% |
| Final Fantasy 14 Dawntrail | 368.15 | 328.86 | -11.947% |
| Horizon Zero Dawn(Favor) | 244 | 228 | -7.018% |
| Hitman 3(Default) | 378.6 | 364.11 | -3.980% |
| Hitman 3(GPU) | 475.35 | 466.94 | -1.801% |
| Rainbow Six Siege(Ultra) | 686 | 614 | -11.726% |
| Shadow of the Tomb Raider(Highest) | 304 | 278 | -9.353% |
| Total War:Three Kingdom | 278 | 262.2 | -6.026% |
1080p 遊戲最容易看出處理器的表現,以我們測試的遊戲中,Intel Core Ultra 9 285K 明顯是處在劣勢;顯示卡使用的是 NVIDIA GeForce RTX 4090 Founders Edition。
CPU - Intel Core i9-14900K
| CPU Benchmark | Intel Core i9-14900K | Intel Core Ultra 9 285K | |
| Cinebench 2024 | |||
| Multi Core | 1778 | 2376 | 25.168% |
| Single Core | 136 | 130 | -4.615% |
| Cinebench 20 | |||
| Multi Core | 12698 | 16617 | 23.584% |
| Single Core | 880 | 778 | -13.111% |
| Cinebench 23 | |||
| Multi Core | 32123 | 42284 | 24.030% |
| Single Core | 2296 | 2103 | -9.177% |
| Geekbench 6 | |||
| Single | 3198 | 2786 | -14.788% |
| Multi | 20255 | 22130 | 8.473% |
| Geekbench AI | |||
| Single Precision | 4662 | 8548 | 45.461% |
| Half Precision | 1641 | 8668 | 81.068% |
| Quantized | 5701 | 14589 | 60.923% |
| Geekbench AI (NPU) OpenVino | |||
| Single Precision | - | 8564 | - |
| Half Precision | - | 7716 | - |
| Quantized | - | 12219 | - |
| Geekbench AI (GPU) OpenVino | |||
| Single Precision | - | 5940 | - |
| Half Precision | - | 9095 | - |
| Quantized | - | 13578 | - |
| CPU-Z | |||
| Single | 947.6 | 906.4 | -4.545% |
| Multi | 14800.1 | 19012.6 | 22.156% |
| CPU Profile | |||
| Max Threads | 14602 | 19434 | 24.864% |
| 16 threads | 10845 | 15133 | 28.335% |
| 8 threads | 8231 | 9842 | 16.369% |
| 4 threads | 4634 | 5011 | 7.523% |
| 2 threads | 2446 | 2587 | 5.450% |
| 1 threads | 1251 | 1255 | 0.319% |
跟著是處理器單核心與多核心效能測試表現,Cinebench 與 Geekbench 部分很容易看到 Intel Core Ultra 9 285K 單核心表現較差,但多核心表現雖然少了 Hyper-Threading 技術,但仍舊比 Intel Core i9-14900K 佳。
Creator - Intel Core i9-14900K
| Creator | Intel Core i9-14900K | Intel Core Ultra 9 285K | |
| Blender | |||
| Monster | 195.61 | 265.61 | 26.354% |
| Junk Store | 140.41 | 173.55 | 19.095% |
| fishy_cat | 89.54 | 130.91 | 31.602% |
| Vray | |||
| CPU | 32620 | 43731 | 25.408% |
| PugetBench -Photoshop | |||
| Overall | 9900 | 9250 | -7.027% |
| General | 99 | 93.1 | -6.337% |
| Filter | 99 | 90.6 | -9.272% |
| PugetBench -Premiere Pro | |||
| Overall | 15554 | 15131 | -2.796% |
| LongGOP Score | 121 | 136 | 11.029% |
| Intraframes Score | 145 | 126 | -15.079% |
| RAW score | 269 | 251 | -7.171% |
| GPU Effects Score | 124 | 122 | -1.639% |
| Handbrake | |||
| AVG. FPS(Very Fast HEVC) | 60.74 | 67.65 | 10.214% |
Overall - Intel Core i9-14900K
| Overall | Intel Core i9-14900K | Intel Core Ultra 9 285K | |
| PC Mark | |||
| Essential | 10384 | 12349 | 15.912% |
| Productivity | 11456 | 12407 | 7.665% |
| Digtal Content Creation | 18461 | 19180 | 3.749% |
| CrossMark | |||
| Overall | 2124 | 2588 | 17.929% |
| Productivity | 1904 | 2338 | 18.563% |
| Creativty | 2605 | 2962 | 12.053% |
| Responsiveness | 1597 | 2344 | 31.869% |
| Procyon office productivity | |||
| Overall | 8724 | 8965 | 2.688% |
| Word | 9899 | 8994 | -10.062% |
| Excel | 9287 | 9816 | 5.389% |
| PowerPoint | 8371 | 9257 | 9.571% |
| Outlook | 6498 | 6971 | 6.785% |
PCMark、Crossmark 與 Procyon Office 部分的綜合性測試,原則上都能見到領 Intel Core Ultra 9 285K 領先 Intel Core i9-14900K。
跟著來看看與 AMD Ryzen 9 9950X 處理器的測試數據比較:
3DMark - AMD Ryzen 9 9950X
| 3DMark | AMD Ryzen 9 9950X | Intel Core Ultra 9 285K | |
| TIme Spy | 30854 | 32094 | 3.864% |
| Graphic score | 36527 | 36663 | 0.371% |
| CPU score | 16411 | 18812 | 12.763% |
| TIme Spy Extreme | 17801 | 18044 | 1.347% |
| Graphic score | 19001 | 18933 | -0.359% |
| CPU score | 13110 | 14210 | 7.741% |
| Fire Strike | 59325 | 45544 | -30.259% |
| Graphic score | 75601 | 62273 | -21.403% |
| Physics score | 57188 | 49455 | -15.636% |
| Combo score | 24649 | 14535 | -69.584% |
| Fire Strike Ultra | 24283 | 24453 | 0.695% |
| Graphic score | 23994 | 24287 | 1.206% |
| Physics score | 51557 | 55125 | 6.473% |
| Combo score | 14260 | 13713 | -3.989% |
| Night Raid | 75324 | 105140 | 28.358% |
| Graphic score | 189566 | 241256 | 21.425% |
| CPU score | 17061 | 25037 | 31.857% |
3DMark 部分中的 Fire Strike 是 AMD Ryzen 9 9950X 有著相當大的優勢,但整體來說,還是 Intel Core Ultra 9 285K 佳。
1080p Gaming - AMD Ryzen 9 9950X
| 1080P Gaming | AMD Ryzen 9 9950X | Intel Core Ultra 9 285K | |
| Borderlands 3(Ultra) | 300.06 | 273.08 | -9.880% |
| Counter-Strike 2 | - | - | - |
| Cyberpunk 2077(Ultra) | 198.41 | 186.78 | -6.227% |
| Dirt 5 | 341.6 | 324.4 | -5.302% |
| F1 23(High) | 312 | 309 | -0.971% |
| Final Fantasy 14 Dawntrail | 392.02 | 328.86 | -19.206% |
| Horizon Zero Dawn(Favor) | 293 | 228 | -28.509% |
| Hitman 3(Default) | 340.67 | 364.11 | 6.438% |
| Hitman 3(GPU) | 461.3 | 466.94 | 1.208% |
| Rainbow Six Siege(Ultra) | 615 | 614 | -0.163% |
| Shadow of the Tomb Raider(Highest) | 297 | 278 | -6.835% |
| Total War:Three Kingdom | 230.2 | 262.2 | 12.204% |
1080p 遊戲表現與 Intel Core i9-14900K 相同,Intel Core Ultra 9 285K 面對 AMD Ryzen 9 9950X 也一樣沒有任何優勢。
CPU - AMD Ryzen 9 9950X
| CPU Benchmark | AMD Ryzen 9 9950X | Intel Core Ultra 9 285K | |
| Cinebench 2024 | |||
| Multi Core | 2295 | 2376 | 3.409% |
| Single Core | 136 | 130 | -4.615% |
| Cinebench R20 | |||
| Multi Core | 16790 | 16617 | -1.041% |
| Single Core | 873 | 778 | -12.211% |
| Cinebench R23 | |||
| Multi Core | 42606 | 42284 | -0.762% |
| Single Core | 2217 | 2103 | -5.421% |
| Geekbench 6 | |||
| Single | 3363 | 2786 | -20.711% |
| Multi | 21048 | 22130 | 4.889% |
| Geekbench AI | |||
| Single Precision | - | 8548 | - |
| Half Precision | - | 8668 | - |
| Quantized | - | 14589 | - |
| Geekbench AI (NPU) OpenVino | |||
| Single Precision | - | 8564 | - |
| Half Precision | - | 7716 | - |
| Quantized | - | 12219 | - |
| Geekbench AI (GPU) OpenVino | |||
| Single Precision | - | 5940 | - |
| Half Precision | - | 9095 | - |
| Quantized | - | 13578 | - |
| CPU-Z | |||
| Single | 864.4 | 906.4 | 4.634% |
| Multi | 17522.8 | 19012.6 | 7.836% |
| CPU Profile | |||
| Max Threads | 17479 | 19434 | 10.060% |
| 16 threads | 11240 | 15133 | 25.725% |
| 8 threads | 6574 | 9842 | 33.205% |
| 4 threads | 4051 | 5011 | 19.158% |
| 2 threads | 2468 | 2587 | 4.600% |
| 1 threads | 1297 | 1255 | -3.347% |
Cinebench 與 Geekbench 部分,Intel Core Ultra 9 285K 單核心沒有任何優勢,但 Intel Core Ultra 9 285K 在 CPU-Z 與 3DMark 的 CPU Profile 則是有著非常不錯的表現。
Creator - AMD Ryzen 9 9950X
| Creator | AMD Ryzen 9 9950X | Intel Core Ultra 9 285K | |
| Blender | |||
| Monster | 277.17 | 265.61 | -4.352% |
| Junk Store | 199.47 | 173.55 | -14.935% |
| fishy_cat | 139.51 | 130.91 | -6.569% |
| Vray | |||
| CPU | 50825 | 43731 | -16.222% |
| PugetBench -Photoshop | |||
| Overall | 11596 | 9250 | -25.362% |
| General | 113 | 93.1 | -21.375% |
| Filter | 119 | 90.6 | -31.347% |
| PugetBench -Premiere Pro | |||
| Overall | 14952 | 15131 | 1.183% |
| LongGOP Score | 124 | 136 | 8.824% |
| Intraframes Score | 127 | 126 | -0.794% |
| RAW score | 258 | 251 | -2.789% |
| GPU Effects Score | 123 | 122 | -0.820% |
| Handbrake | |||
| AVG. FPS(Very Fast HEVC) | 61.72 | 67.65 | 8.766% |
Overall - AMD Ryzen 9 9950X
| Overall | AMD Ryzen 9 9950X | Intel Core Ultra 9 285K | |
| PC Mark | |||
| Essential | 12472 | 12349 | -0.996% |
| Productivity | 13641 | 12407 | -9.946% |
| Digtal Content Creation | 21132 | 19180 | -10.177% |
| CrossMark | |||
| Overall | 2276 | 2588 | 12.056% |
| Productivity | 2005 | 2338 | 14.243% |
| Creativty | 2863 | 2962 | 3.342% |
| Responsiveness | 1669 | 2344 | 28.797% |
| Procyon office productivity | |||
| Overall | 8769 | 8965 | 2.186% |
| Word | 9034 | 8994 | -0.445% |
| Excel | 10559 | 9816 | -7.569% |
| PowerPoint | 8541 | 9257 | 7.735% |
| Outlook | 6607 | 6971 | 5.222% |
綜合測試來看,AMD Ryzen 9 9950X 在 PCMark 是處於領先,且在 Procyon Office 中 的 Word 與 Excel 都有著不差的優勢,只是整體來說,還是 Intel Core Ultra 9 285K 還是有一定優勢。
跟著看看 3 款處理器在 AIDA64 測試軟體中,Memory Test 部分的數據,此篇測試,不論是 Intel Core Ultra 200S、14th Gen Intel Core,或者是 AMD Ryzen 9000 系列處理器,皆使用 DDR5-6400MT/s CL36 記憶體。
AIDA64 Memory Test - Intel Core Ultra 9 285K
| AIDA64 Memory Test | AMD Ryzen 9 9950X | Intel Core i9-14900K | Intel Core Ultra 9 285K |
| Memory Read(MB/S) | 81139 | 100890 | 97271 |
| Write | 82158 | 87457 | 87436 |
| Copy | 72733 | 90792 | 108.78 |
| Latency(ns) | 77.3 | 65.6 | 92.6 |
| L1 Cache Read(GB/S) | 10421.5 | 5575 | 5724.1 |
| Write | 5238.9 | 3333.9 | 4002 |
| Copy | 9883.1 | 7640.5 | 8261.8 |
| Latency(ns) | 0.7 | 0.9 | 0.7 |
| L2 Cache Read(GB/S) | 3835 | 1491 | 783.08 |
| Write | 3119 | 638.85 | 640.78 |
| Copy | 3636.4 | 999.65 | 764.79 |
| Latency(ns) | 2.5 | 3.6 | 4 |
| L3 Cache Read(GB/S) | 1399.6 | 1215.3 | 25490 |
| Write | 1871.5 | 573.59 | 1269.3 |
| Copy | 1355.1 | 710.49 | 1602.9 |
| Latency(ns) | 11.4 | 18.6 | 16 |
測試用的作業系統為 Windows 11 23H2,原先我們使用 Windows 11 24H2,但測試中發現 Intel Core Ultra 9 285K 有效能低落的情況,因此在測試完一輪之後,我們立刻將作業系統更換為 Windows 11 23H2。
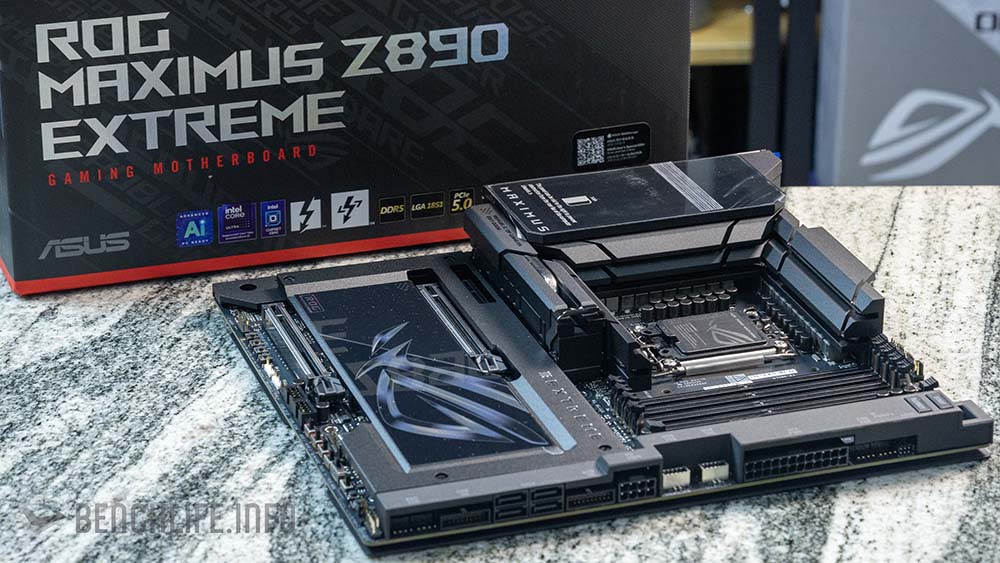
Arrow Lake-S 世代 Intel Core Ultra 9 285K、Core Ultra 7 265K 與 Core Ultra 5 245K 測試,使用的是 ASUS 提供的 ROG Maximus Z890 Extreme 主機板,更多關於 ROG Maximus Z890 Extreme 主機板的介紹,可以參考「旗艦級的 LGA 1851 腳位主機板,ASUS ROG Maximus Z890 Extreme 開箱」。記憶體部分為 DDR5-6400 MT/s CL36,而顯示卡部分為 NVIDIA GeForce RTX 4090 Founders Edition。
Intel 強調 Intel Core Ultra 200S 在遊戲部分的功耗較 14th Gen 底,我們也做了相關測試。
在 Cyberpunk 2077、Shadow of the Tomb Raider 以及 Counter-Strike 2 遊戲中,我們可以見到 Intel Core Ultra 9 285K 處理器的平均功耗分別是 123.4W、92.09W 以及 71.56W,至於 Intel Core i9-14900K 則是 188.4W、192.2W 以及 159.4W。
我們以 NVIDIA GeForce RTX 4090 Founders Edition 搭配測試,發現到 Intel Core Ultra 9 285K 在 Cyperpunk 2077 與 Shadow of the Tomb Raider 落後 Intel Core i4-14900K 約 10%,但 Intel Core Ultra 9 285K 則是在 Counter-Strike 2 應 Intel Core i9-14900K 約 9.5%。
如果就 Intel Core Ultra 9 285K 的單核心表現來看,大致上要比 Intel Core i9-14900K 與 AMD Ryzen 9 9950X 弱;單核心效能表現不佳問題,都能夠在 Intel Core Ultra 7 265K 與 Intel Core Ultra 5 245K 的測試中見到。
少了 Hyper-Threading 技術,Arrow Lake-S 世代的多核心表現其實不差。
遊戲方面,雖然效能是落後於 Intel Core i9-14900K 與 AMD Ryzen 9 9950X,可是 Intel Core Ultra 9 285K 功耗較低表現,給了我們不少的驚喜感。