最後一顆處理器比較,我們要來看看 Intel Core Ultra 5 245K。
Intel Core Ultra 5 245K 是一款 6 + 8 核心(P-Cores + E-Cores),共計 14C14T 的不鎖頻處理器。
![]()
![]()
![]()
![]()
與 Intel Core Ultra 7 265K 相同,Intel Core Ultra 5 245K 同樣提供不帶 iGPU 的版本,其型號為 Intel Core Ultra 5 245KF。因為沒有 iGPU,因此處理器的整體 TOPS 表現數字會較 Intel Core Ultra 5 245K 低,但就日常遊戲或是影音剪輯來說,實際效能不會有太大差距,畢竟你還總會為它,搭配上一張獨立顯示卡。
Intel Core Ultra 5 245K Spec
| Intel Core Ultra 5 245K | Intel Core i5-14600K | AMD Ryzen 7 9700X | |
| Cores | 14(6 + 8) | 14(6 + 8) | 8 |
| Threads | 14 | 20 | 16 |
| L2 Cache | 26MB | 20MB | 8MB |
| Intel Smart Cache(L3) | 24MB | 24MB | 32MB |
| P-Cores Frequency(Base) | 3.7GHz | 3.5GHz | 3.8GHz |
| E-Cores Frequency(Base) | 3.6GHz | 2.6GHz | - |
| P-Cores Max Turbo Frequency | Up to 5.2GHz | Up to 5.3GHz | 5.5GHz |
| E-Cores Max Turbo Frequency | Up to 4.6GHz | Up to 4.0GHz | - |
| Thermal Velocity Boost | Up to 5.2GHz | Up to 5.3GHz | - |
| Turbo Boost Max Technology 3.0 | - | - | - |
| Native Memory | DDR5-6400 MT/s | DDR5-5600 MT/s DDR4-3200 MT/s | DDR5-5600 MT/s |
| Processor Base Power | 125W | 125W | 65W |
| Maximum Turbo Power | 159W | 181W | - |
Intel 部分,比較對象當然是 14th Gen 的 Intel Core i5-14600K,這款同樣是 6 + 8 核心,20 執行緒的處理器。
L2 Cache 來說,Intel Core Ultra 5 245K 較大,為 26MB 配置,但 Intel Smart Cache(L3)配置,兩者相同。
AMD 方面,我們選擇 8C16T 的 AMD Ryzen 7 9700X 進行比較。
1. Intel Core Ultra 9 285K,我們會與 Intel Core i9-14900K 和 AMD Ryzen 9 9950X 進行測試比較;
延伸閱讀 – Arrow Lake- S 世代的 Intel Core Ultra 9 285K 實測
2. Intel Core Ultra 7 265K 則會與 Intel Core i7-14700K 和 AMD Ryzen 9 9900X 比較;
延伸閱讀 – Arrow Lake- S 世代的 Intel Core Ultra 7 265K 實測
3. 最後,是 Intel Core Ultra 5 245K,這顆處理器會與 Intel Core i5-14600K 和 AMD Ryzen 7 9700X 進行比較。
需要留意的是,Intel Core Ultra 5 245K 沒有 Intel Turbo Max Technology 3.0 技術,因此其最高時脈為 5.2GHz;P-Cores Max Turbo Frequency 與 Intel Thermal Velocity Boost 相同。
先來看看呢 Intel Core Ultra 5 245K 與 Intel Core i5-14600K 的數據比較。
3DMark - Intel Core i5-14600K
| 3DMark | Intel Core i5-14600K | Intel Core Ultra 5 245K | |
| TIme Spy | 31440 | 30981 | -1.482% |
| Graphic score | 36609 | 36750 | 0.384% |
| CPU score | 17466 | 16396 | -6.526% |
| TIme Spy Extreme | 15410 | 15978 | 3.555% |
| Graphic score | 18949 | 18978 | 0.153% |
| CPU score | 7487 | 8419 | 11.070% |
| Fire Strike | 50846 | 51581 | 1.425% |
| Graphic score | 83233 | 81096 | -2.635% |
| Physics score | 38727 | 40714 | 4.880% |
| Combo score | 14743 | 15494 | 4.847% |
| Fire Strike Ultra | 24044 | 24387 | 1.406% |
| Graphic score | 24879 | 24873 | -0.024% |
| Physics score | 37363 | 38477 | 2.895% |
| Combo score | 13420 | 14382 | 6.689% |
| Night Raid | 83805 | 91505 | 8.415% |
| graphic score | 198812 | 209773 | 5.225% |
| cpu score | 19590 | 21814 | 10.195% |
3DMark 部分,Intel Core Ultra 5 245K 表現與 Intel Core i5-14600K 相差不大,甚至可以用「相同」來形容。只是,Time Spy 部分的 CPU Score 可以發現到 Intel Core Ultra 5 245K 是落後於 Intel Core i5-14600K。
Intel Core Ultra 5 245K 在遊戲部分依舊沒有任何優勢。
1080p Gaming - Intel Core i5-14600K
| 1080P Gaming | Intel Core i5-14600K | Intel Core Ultra 5 245K | |
| Borderlands 3(Ultra) | 269.46 | 256.79 | -4.934% |
| Counter-Strike 2 | - | 438.8 | - |
| Cyberpunk 2077(Ultra) | 181.1 | 180.32 | -0.433% |
| Dirt 5 | 260.2 | 297.3 | 12.479% |
| F1 23(High) | 266 | 291 | 8.591% |
| Final Fantasy 14 Dawntrail | 300.12 | 291.58 | -2.929% |
| Horizon Zero Dawn(Favor) | 254 | 219 | -15.982% |
| Hitman 3(Default) | 342.9 | 304.89 | -12.467% |
| Hitman 3(GPU) | 375.75 | 437.87 | 14.187% |
| Rainbow Six Siege(Ultra) | 579 | 453 | -27.815% |
| Shadow of the Tomb Raider(Highest) | 280 | 261 | -7.280% |
| Total War:Three Kingdom | 260.1 | 240 | -8.375% |
Creator - Intel Core i5-14600K
| Creator | Intel Core i5-14600K | Intel Core Ultra 5 245K | |
| Blender | |||
| Monster | 137.83 | 150.49 | 8.413% |
| Junk Store | 97.53 | 100.54 | 2.994% |
| fishy_cat | 67.36 | 74.5 | 9.584% |
| Vray | |||
| CPU | 22084 | 24924 | 11.395% |
| PugetBench -Photoshop | |||
| Overall | 9749 | 9150 | -6.546% |
| General | 96 | 92 | -4.348% |
| Filter | 99 | 91 | -8.791% |
| PugetBench -Premiere Pro | |||
| Overall | 12428 | 14281 | 12.975% |
| LongGOP Score | 107 | 122 | 12.295% |
| Intraframes Score | 97 | 113 | 14.159% |
| RAW score | 221 | 267 | 17.228% |
| GPU Effects Score | 104 | 113 | 7.965% |
| Handbrake | |||
| AVG. FPS(Very Fast HEVC) | 39.508 | 49.45 | 20.105% |
除了 PugetBench – Photoshop 這個測試項目,我們在 Creator 這分類的其他測試項目中,可以見到 Intel Core Ultra 5 245K 有著較佳的表現。
CPU - Intel Core i5-14600K
| CPU Benchmark | Intel Core i5-14600K | Intel Core Ultra 5 245K | |
| Cinebench 2024 | |||
| Multi Core | 1246 | 1488 | 16.263% |
| Single Core | 121 | 131 | 7.634% |
| Cinebench 20 | |||
| Multi Core | 8395 | 9878 | 15.013% |
| Single Core | 784 | 800 | 2.000% |
| Cinebench 23 | |||
| Multi Core | 20909 | 25132 | 16.803% |
| Single Core | 2046 | 2050 | 0.195% |
| Geekbench 6 | |||
| Single | 2835 | 3059 | 7.323% |
| Multi | 17567 | 17954 | 2.156% |
| Geekbench AI | |||
| Single Precision | - | 4667 | - |
| Half Precision | - | 4754 | - |
| Quantized | - | 11808 | - |
| Geekbench AI (NPU) OpenVino | |||
| Single Precision | - | 4785 | - |
| Half Precision | - | 7803 | - |
| Quantized | - | 12165 | - |
| Geekbench AI (GPU) OpenVino | |||
| Single Precision | - | 5647 | - |
| Half Precision | - | 8684 | - |
| Quantized | - | 13050 | - |
| CPU-Z | |||
| Single | 862.3 | 801.3 | -7.613% |
| Multi | 9812.1 | 10782.1 | 8.996% |
| CPU Profile | |||
| Max Threads | 10109 | 12075 | 16.282% |
| 16 threads | 9493 | 12166 | 21.971% |
| 8 threads | 7305 | 8537 | 14.431% |
| 4 threads | 4501 | 4761 | 5.461% |
| 2 threads | 2271 | 2384 | 4.740% |
| 1 threads | 1115 | 1064 | -4.793% |
Intel Core Ultra 5 245K 的單核心與多核心效能表現,都要比 Intel Core i5-14600K 佳,這部分從 Cinebench、Geekbench 與 3DMark 的 CPU Profile 測試可以見到。
話雖如此,但來到綜合性軟體測試如 PCMark 與 Crossmark,Intel Core i5-14600K 就將狀況翻轉過來;基本上,我們可以見到 PCMark 與 Crossmark 測試軟體中,Intel Core i5-14600K 有著雙位數的領先。
Overall - Intel Core i5-14600K
| Overall | Intel Core i5-14600K | Intel Core Ultra 5 245K | |
| PC Mark | |||
| Essential | 12026 | 10635 | -13.079% |
| Productivity | 12519 | 11380 | -10.009% |
| Digtal Content Creation | 16729 | 16891 | 0.959% |
| CrossMark | |||
| Overall | 2328 | 1930 | -20.622% |
| Productivity | 2110 | 1750 | -20.571% |
| Creativty | 2643 | 2368 | -11.613% |
| Responsiveness | 2134 | 1402 | -52.211% |
| Procyon office productivity | |||
| Overall | - | 8068 | - |
| Word | - | 8564 | - |
| Excel | - | 8647 | - |
| PowerPoint | - | 8162 | - |
| Outlook | - | 6096 | - |
跟著我們來看看 Intel Core Ultra 5 245K 與 AMD Ryzen 7 9700X 的測試數據比較。
3DMark - AMD Ryzen 7 9700X
| 3DMark | AMD Ryzen 7 9700X | Intel Core Ultra 5 245K | |
| TIme Spy | 29303 | 30981 | 5.416% |
| Graphic score | 36070 | 36750 | 1.850% |
| CPU score | 14204 | 16396 | 13.369% |
| TIme Spy Extreme | 14861 | 15978 | 6.991% |
| Graphic score | 18976 | 18978 | 0.011% |
| CPU score | 6675 | 8419 | 20.715% |
| Fire Strike | 52394 | 51581 | -1.576% |
| Graphic score | 77474 | 81096 | 4.466% |
| Physics score | 37792 | 40714 | 7.177% |
| Combo score | 18351 | 15494 | -18.439% |
| Fire Strike Ultra | 23676 | 24387 | 2.915% |
| Graphic score | 24069 | 24873 | 3.232% |
| Physics score | 37394 | 38477 | 2.815% |
| Combo score | 14157 | 14382 | 1.564% |
| Night Raid | 73376 | 91505 | 19.812% |
| graphic score | 187398 | 209773 | 10.666% |
| cpu score | 16497 | 21814 | 24.374% |
1080p Gaming - AMD Ryzen 7 9700X
| 1080P Gaming | AMD Ryzen 7 9700X | Intel Core Ultra 5 245K | |
| Borderlands 3(Ultra) | 297.18 | 256.79 | -15.729% |
| Counter-Strike 2 | - | 438.8 | - |
| Cyberpunk 2077(Ultra) | 217.4 | 180.32 | -20.563% |
| Dirt 5 | 330.5 | 297.3 | -11.167% |
| F1 23(High) | 307 | 291 | -5.498% |
| Final Fantasy 14 Dawntrail | 390.67 | 291.58 | -33.984% |
| Horizon Zero Dawn(Favor) | 260 | 219 | -18.721% |
| Hitman 3(Default) | 333.98 | 304.89 | -9.541% |
| Hitman 3(GPU) | 457.7 | 437.87 | -4.529% |
| Rainbow Six Siege(Ultra) | 622 | 453 | -37.307% |
| Shadow of the Tomb Raider(Highest) | 314 | 261 | -20.307% |
| Total War:Three Kingdom | 232.5 | 240 | 3.125% |
3DMark 的測試數據,與我們實際使用遊戲進行測試,有著完全不一樣的局面。
可以見到 3DMark 基本上是 Intel Core Ultra 5 245K 是領先 AMD Ryzen 7 9700X,然而到了實際遊戲表現,AMD Ryzen 7 9700X 將整個局面轉變過來,讓 Intel Core Ultra 5 245K 處在落後的情況。此測試數據使用的是 Windows 11 23H2 搭配 NVIDIA GeForce RTX 4090 Founders Edition 進行,若使用 Windows 11 24H2,Intel Core Ultra 5 245K 在 1080p 的遊戲測試數據會更為慘烈。
Creator - AMD Ryzen 7 9700X
| Creator | AMD Ryzen 7 9700X | Intel Core Ultra 5 245K | |
| Blender | |||
| Monster | 127.89 | 150.49 | 15.018% |
| Junk Store | 92.99 | 100.54 | 7.509% |
| fishy_cat | 63.96 | 74.5 | 14.148% |
| Vray | |||
| CPU | 23528 | 24924 | 5.601% |
| PugetBench -Photoshop | |||
| Overall | 11447 | 9150 | -25.104% |
| General | 112 | 92 | -21.739% |
| Filter | 117 | 91 | -28.571% |
| PugetBench -Premiere Pro | |||
| Overall | 12959 | 14281 | 9.257% |
| LongGOP Score | 92 | 122 | 24.590% |
| Intraframes Score | 104 | 113 | 7.965% |
| RAW score | 268 | 267 | -0.375% |
| GPU Effects Score | 110 | 113 | 2.655% |
| Handbrake | |||
| AVG. FPS(Very Fast HEVC) | 38 | 49.45 | 23.155% |
Creator 部分依舊是 PugetBench – Photoshop 部分表現較差,其餘測試項目是 Intel Core Ultra 5 245K 表現較佳。
CPU - AMD Ryzen 7 9700X
| CPU Benchmark | AMD Ryzen 7 9700X | Intel Core Ultra 5 245K | |
| Cinebench 2024 | |||
| Multi Core | 1177 | 1488 | 20.901% |
| Single Core | 135 | 131 | -3.053% |
| Cinebench 20 | |||
| Multi Core | 7877 | 9878 | 20.257% |
| Single Core | 860 | 800 | -7.500% |
| Cinebench 23 | |||
| Multi Core | 20049 | 25132 | 20.225% |
| Single Core | 2185 | 2050 | -6.585% |
| Geekbench 6 | |||
| Single | 3393 | 3059 | -10.919% |
| Multi | 16970 | 17954 | 5.481% |
| Geekbench AI | |||
| Single Precision | 4667 | - | |
| Half Precision | 4754 | - | |
| Quantized | 11808 | - | |
| Geekbench AI (NPU) OpenVino | |||
| Single Precision | 4785 | - | |
| Half Precision | 7803 | - | |
| Quantized | 12165 | - | |
| Geekbench AI (GPU) OpenVino | |||
| Single Precision | 5647 | - | |
| Half Precision | 8684 | - | |
| Quantized | 13050 | - | |
| CPU-Z | |||
| Single | 873.2 | 801.3 | -8.973% |
| Multi | 8307.2 | 10782.1 | 22.954% |
| CPU Profile | |||
| Max Threads | 9234 | 12075 | 23.528% |
| 16 threads | 9242 | 12166 | 24.034% |
| 8 threads | 6362 | 8537 | 25.477% |
| 4 threads | 3911 | 4761 | 17.853% |
| 2 threads | 2374 | 2384 | 0.419% |
| 1 threads | 1260 | 1064 | -18.421% |
與 Intel Core Ultra 9 285K 和 Intel Core Ultra 7 265K 相同,Intel Core Ultra 5 245K 在單核心部分,依舊沒有太突出的表現。
Overall - AMD Ryzen 7 9700X
| Overall | AMD Ryzen 7 9700X | Intel Core Ultra 5 245K | |
| PC Mark | |||
| Essential | 12483 | 10635 | -17.377% |
| Productivity | 13513 | 11380 | -18.743% |
| Digtal Content Creation | 18179 | 16891 | -7.625% |
| CrossMark | |||
| Overall | 2074 | 1930 | -7.461% |
| Productivity | 1879 | 1750 | -7.371% |
| Creativty | 2555 | 2368 | -7.897% |
| Responsiveness | 1493 | 1402 | -6.491% |
| Procyon office productivity | |||
| Overall | - | 8068 | - |
| Word | - | 8564 | - |
| Excel | - | 8647 | - |
| PowerPoint | - | 8162 | - |
| Outlook | - | 6096 | - |
最後的綜合性測試,8C16T 的 AMD Ryzen 7 9700X 表現依然較 14C14T 的 Intel Core Ultra 5 245K 佳。
Intel Core Ultra 200S 的省電遊戲在 Intel Core Ultra 9 285K 與 Intel Core Ultra 7 265K 的測試中,我們已經強調許多,在這裏就不再敘述 Intel Core Ultra 5 245K 的省電優勢。
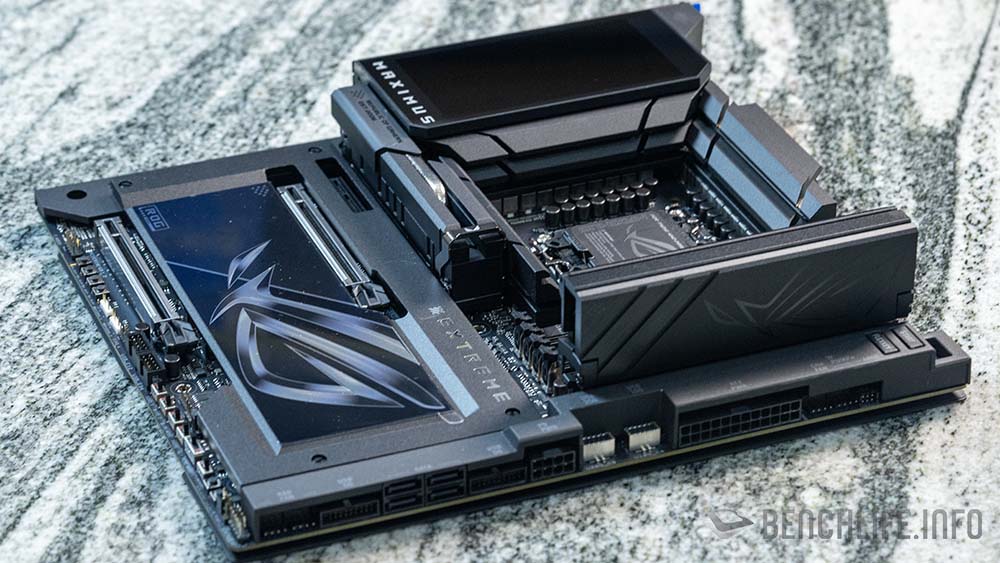
Arrow Lake-S 世代 Intel Core Ultra 9 285K、Core Ultra 7 265K 與 Core Ultra 5 245K 測試,使用的是 ASUS 提供的 ROG Maximus Z890 Extreme 主機板,更多關於 ROG Maximus Z890 Extreme 主機板的介紹,可以參考「旗艦級的 LGA 1851 腳位主機板,ASUS ROG Maximus Z890 Extreme 開箱」。記憶體部分為 DDR5-6400 MT/s CL36,而顯示卡部分為 NVIDIA GeForce RTX 4090 Founders Edition。