看完旗艦的 Intel Core Ultra 9 285K,跟著我們來看看 Intel Core Ultra 7 265K。
![]()
![]()
![]()
Intel Core Ultra 7 265K 是一款 8 + 12(P-Cores + E-Cores),共計 20C20T 配置的處理器。與 Intel Core Ultra 9 285K 不同,Intel Core Ultra 7 265K 還有沒有 iGPU 的版本,也就是 Intel Core Ultra 7 265KF。
Intel Core Ultra 7 265K Spec
| Intel Core Ultra 7 265K | Intel Core i7-14700K | AMD Ryzen 9 9900X | |
| Cores | 20(8 + 12) | 20(8 + 12) | 12 |
| Threads | 20 | 28 | 24 |
| L2 Cache | 36MB | 28MB | 12MB |
| Intel Smart Cache(L3) | 32MB | 33MB | 64MB |
| P-Cores Frequency(Base) | 3.9GHz | 3.4GHz | 4.4GHz |
| E-Cores Frequency(Base) | 3.3GHz | 2.5GHz | - |
| P-Cores Max Turbo Frequency | Up to 5.4GHz | Up to 5.5GHz | 5.6GHz |
| E-Cores Max Turbo Frequency | Up to 4.6GHz | Up to 4.3GHz | - |
| Thermal Velocity Boost | Up to 5.5GHz | Up to 5.6GHz | - |
| Turbo Boost Max Technology 3.0 | Up to 5.6GHz | Up to 5.6GHz | - |
| Native Memory | DDR5-6400 MT/s | DDR5-5600 MT/s DDR4-3200 MT/s | DDR5-5600 MT/s |
| Processor Base Power | 125W | 125W | 120W |
| Maximum Turbo Power | 250W | 253W | - |
測試比較對象,原則上應該是 Intel Core i7-14700K 與 AMD Ryzen 9 9900X,所以我們就把它們找來一起進行。
Intel Core Ultra 7 265K 的 P-Cores 與 E-Cores 時脈都較 Intel Core i7-14700K 高,特別是 E-Cores 部分高出 0.8GHz。
![]()
同樣的,可以留意到 Intel Core Ultra 7 265K 的 L2 與 L3 Cache(或稱 Intel Smart Cache)都要比 Intel Core i7-14700K 多。
1. Intel Core Ultra 9 285K,我們會與 Intel Core i9-14900K 和 AMD Ryzen 9 9950X 進行測試比較;
延伸閱讀 – Arrow Lake- S 世代的 Intel Core Ultra 9 285K 實測
2. Intel Core Ultra 7 265K 則會與 Intel Core i7-14700K 和 AMD Ryzen 9 9900X 比較;
延伸閱讀 – Arrow Lake- S 世代的 Intel Core Ultra 7 265K 實測
3. 最後,是 Intel Core Ultra 5 245K,這顆處理器會與 Intel Core i5-14600K 和 AMD Ryzen 7 9700X 進行比較。
原則上,Intel Core Ultra 7 265K 與 Intel Core Ultra 9 285K 的功耗沒有不同,分別是 125W(Processor Base Power)與 250W(Maximum Turbo Power),但要比 Intel Core i7-14700K 的 253W 底了 3W。
12C24T 的 AMD Ryzen 9 9900X 基本時脈 4.4GHz,最高時脈可以達到 5.6GHz,TDP 為 120W。
跟著來看看 Intel Core Ultra 7 265K 與 Intel Core i7-14700K 和 AMD Ryzen 9 9900X 的比較數據。
與過去的測試相同,數據會分為 3DMark、1080p Gaming、Creator、CPU 與綜合性的 Overall 測試。
3DMark - Intel Core i7-14700K
| 3DMark | Intel Core i7-14700K | Intel Core Ultra 7 265K | |
| TIme Spy | 31629 | 33558 | 5.748% |
| Graphic score | 36722 | 36768 | 0.125% |
| CPU score | 17712 | 22451 | 21.108% |
| TIme Spy Extreme | 17580 | 17311 | -1.554% |
| Graphic score | 18995 | 19208 | 1.109% |
| CPU score | 12365 | 11102 | -11.376% |
| Fire Strike | 50700 | 57108 | 11.221% |
| Graphic score | 64464 | 74808 | 13.827% |
| Physics score | 48427 | 50764 | 4.604% |
| Combo score | 20033 | 22075 | 9.250% |
| Fire Strike Ultra | 24617 | 24912 | 1.184% |
| Graphic score | 24520 | 24718 | 0.801% |
| Physics score | 48162 | 50831 | 5.251% |
| Combo score | 14450 | 14605 | 1.061% |
| Night Raid | 90480 | 97516 | 7.215% |
| graphic score | 180873 | 226181 | 20.032% |
| cpu score | 23612 | 23089 | -2.265% |
Intel Core Ultra 7 265K 在 3DMark 部分領先 Intel Core i7-14700K,但也可以見到 Time Spy Extreme 部分的 CPU Score,Intel Core Ultra 7 265K 落後 Intel Core i7-14700K 多達 11%。
因為 CPU Score 的落後,因此 Intel Core Ultra 7 265K 在 Time Spy Extreme 是小幅度落後 Intel Core i7-14700K。
1080p Gaming - Intel Core i7-14700K
| 1080P Gaming | Intel Core i7-14700K | Intel Core Ultra 7 265K | |
| Borderlands 3(Ultra) | 281.31 | 275.34 | -2.168% |
| Counter-Strike 2 | - | - | - |
| Cyberpunk 2077(Ultra) | 191.65 | 187.31 | -2.317% |
| Dirt 5 | 289.4 | 304.6 | 4.990% |
| F1 23(High) | 290 | 298 | 2.685% |
| Final Fantasy 14 Dawntrail | 347.64 | 294.2 | -18.165% |
| Horizon Zero Dawn(Favor) | 259 | 224 | -15.625% |
| Hitman 3(Default) | 363.27 | 330.83 | -9.806% |
| Hitman 3(GPU) | 402.71 | 456.89 | 11.858% |
| Rainbow Six Siege(Ultra) | 701 | 589 | -19.015% |
| Shadow of the Tomb Raider(Highest) | 316 | 273 | -15.751% |
| Total War:Three Kingdom | 279.7 | 260.8 | -7.247% |
遊戲方面仍舊是以 1080p 進行,在我們的多款遊戲中,Intel Core Ultra 7 265K 與 Intel Core i7-14700K 各有輸贏。然而從數據中,我們可以發現 Intel Core Ultra 7 265K 在多款遊戲中,與 Intel Core i7-14700K 有著 10% 以上的差距。
Creator - Intel Core i7-14700K
| Creator | Intel Core i7-14700K | Intel Core Ultra 7 265K | |
| Blender | |||
| Monster | 199.6 | 217.44 | 8.205% |
| Junk Store | 139.75 | 143.6 | 2.681% |
| fishy_cat | 93.65 | 106.9 | 12.395% |
| Vray | |||
| CPU | 33419 | 35429 | 5.673% |
| PugetBench -Photoshop | |||
| Overall | 10140 | 9199 | -10.229% |
| General | 97 | 92.4 | -4.978% |
| Filter | 106 | 91.6 | -15.721% |
| PugetBench -Premiere Pro | |||
| Overall | 13869 | 15325 | 9.501% |
| LongGOP Score | 94 | 126 | 25.397% |
| Intraframes Score | 129 | 132 | 2.273% |
| RAW score | 270 | 271 | 0.369% |
| GPU Effects Score | 113 | 123 | 8.130% |
| Handbrake | |||
| AVG. FPS(Very Fast HEVC) | 51.195 | 57.45 | 10.888% |
CPU - Intel Core i7-14700K
| CPU Benchmark | Intel Core i7-14700K | Intel Core Ultra 7 265K | |
| Cinebench 2024 | |||
| Multi Core | 1817 | 2012 | 9.692% |
| Single Core | 129 | 120 | -7.500% |
| Cinebench 20 | |||
| Multi Core | 12127 | 14062 | 13.760% |
| Single Core | 832 | 754 | -10.345% |
| Cinebench 23 | |||
| Multi Core | 31362 | 35764 | 12.308% |
| Single Core | 2177 | 1990 | -9.397% |
| Geekbench 6 | |||
| Single | 3081 | 2680 | -14.963% |
| Multi | 20596 | 20926 | 1.577% |
| Geekbench AI | |||
| Single Precision | - | 5715 | - |
| Half Precision | - | 5734 | - |
| Quantized | - | 14098 | - |
| Geekbench AI (NPU) OpenVino | |||
| Single Precision | - | 5604 | - |
| Half Precision | - | 7731 | - |
| Quantized | - | 11817 | - |
| Geekbench AI (GPU) OpenVino | |||
| Single Precision | - | 5882 | - |
| Half Precision | - | 9166 | - |
| Quantized | - | 13465 | - |
| CPU-Z | |||
| Single | 909.7 | 872.8 | -4.228% |
| Multi | 13955.8 | 15734.6 | 11.305% |
| CPU Profile | |||
| Max Threads | 14203 | 16853 | 15.724% |
| 16 threads | 11191 | 14843 | 24.604% |
| 8 threads | 8851 | 9542 | 7.242% |
| 4 threads | 4699 | 4846 | 3.033% |
| 2 threads | 2398 | 2486 | 3.540% |
| 1 threads | 1203 | 1222 | 1.555% |
單核心表現依舊是 Arrow Lake-S 的弱項,Intel Core Ultra 7 265K 在 Cinebench、Geekbench 與 CPU-Z 中,單核心表現都落後 Intel Core i7-14700K。
Overall - Intel Core i7-14700K
| Overall | Intel Core i7-14700K | Intel Core Ultra 7 265K | |
| PC Mark | |||
| Essential | 12632 | 10470 | -20.649% |
| Productivity | 11904 | 11290 | -5.438% |
| Digtal Content Creation | 19457 | 17765 | -9.524% |
| CrossMark | |||
| Overall | 2426 | 2034 | -19.272% |
| Productivity | 2156 | 1839 | -17.238% |
| Creativty | 2882 | 2516 | -14.547% |
| Responsiveness | 2061 | 1457 | -41.455% |
| Procyon office productivity | |||
| Overall | - | 8069 | - |
| Word | - | 8865 | - |
| Excel | - | 8682 | - |
| PowerPoint | - | 8045 | - |
| Outlook | - | 5809 | - |
綜合性測試來看,Intel Core Ultra 7 265K 顯然沒有任何優勢存在。
接下來,看看 Intel Core Ultra 7 265K 與 AMD Ryzen 9 9900X 的測試比較。
3DMark - AMD Ryzen 9 9900X
| 3DMark | AMD Ryzen 9 9900X | Intel Core Ultra 7 265K | |
| TIme Spy | 30671 | 32546 | 5.761% |
| Graphic score | 36556 | 36895 | 0.919% |
| CPU score | 16040 | 19514 | 17.803% |
| TIme Spy Extreme | 16830 | 17565 | 4.184% |
| Graphic score | 18898 | 19006 | 0.568% |
| CPU score | 10390 | 12287 | 15.439% |
| Fire Strike | 54790 | 54099 | -1.277% |
| Graphic score | 76985 | 73072 | -5.355% |
| Physics score | 46259 | 49142 | 5.867% |
| Combo score | 18988 | 21268 | 10.720% |
| Fire Strike Ultra | 24122 | 24496 | 1.527% |
| Graphic score | 24049 | 24545 | 2.021% |
| Physics score | 45965 | 44229 | -3.925% |
| Combo score | 14274 | 14548 | 1.883% |
| Night Raid | 74459 | 98838 | 24.666% |
| graphic score | 188670 | 219645 | 14.102% |
| cpu score | 16807 | 24009 | 29.997% |
與 12C24T 的 AMD Ryzen 9 9900X 比較的話,Intel Core Ultra 7 265K 雖然在 3DMark 都處於優勢,但實際上到了 1080p 遊戲測試,很明顯的是落後於 AMD Ryzen 9 9900X。
1080p Gaming - AMD Ryzen 9 9900X
| 1080P Gaming | AMD Ryzen 9 9900X | Intel Core Ultra 7 265K | |
| Borderlands 3(Ultra) | 287.57 | 275.34 | -4.442% |
| Counter-Strike 2 | - | - | - |
| Cyberpunk 2077(Ultra) | 192.5 | 187.31 | -2.771% |
| Dirt 5 | 334 | 304.6 | -9.652% |
| F1 23(High) | 310 | 298 | -4.027% |
| Final Fantasy 14 Dawntrail | 372.17 | 294.2 | -26.502% |
| Horizon Zero Dawn(Favor) | 266 | 224 | -18.750% |
| Hitman 3(Default) | 319.13 | 330.83 | 3.537% |
| Hitman 3(GPU) | 451.61 | 456.89 | 1.156% |
| Rainbow Six Siege(Ultra) | 572 | 589 | 2.886% |
| Shadow of the Tomb Raider(Highest) | 285 | 273 | -4.396% |
| Total War:Three Kingdom | 229 | 260.8 | 12.193% |
Creator - AMD Ryzen 9 9900X
| Creator | AMD Ryzen 9 9900X | Intel Core Ultra 7 265K | |
| Blender | |||
| Monster | 207.45 | 217.44 | 4.594% |
| Junk Store | 148.4 | 143.6 | -3.343% |
| fishy_cat | 105.1 | 106.9 | 1.684% |
| Vray | |||
| CPU | 38462 | 35429 | -8.561% |
| PugetBench -Photoshop | |||
| Overall | 10936 | 9199 | -18.882% |
| General | 104 | 92.4 | -12.554% |
| Filter | 115 | 91.6 | -25.546% |
| PugetBench -Premiere Pro | |||
| Overall | 14479 | 15325 | 5.520% |
| LongGOP Score | 116 | 126 | 7.937% |
| Intraframes Score | 124 | 132 | 6.061% |
| RAW score | 268 | 271 | 1.107% |
| GPU Effects Score | 114 | 123 | 7.317% |
| Handbrake | |||
| AVG. FPS(Very Fast HEVC) | 51.8 | 57.45 | 9.835% |
與 Intel Core i7-14700K 的測試相同,AMD Ryzen 9 9900X 在 PugetBench – Photoshop 的測試項目中,依舊是領先 Intel Core Ultra 7 265K。
CPU - AMD Ryzen 9 9900X
| CPU Benchmark | AMD Ryzen 9 9900X | Intel Core Ultra 7 265K | |
| Cinebench 2024 | |||
| Multi Core | 1769 | 2012 | 12.078% |
| Single Core | 133 | 120 | -10.833% |
| Cinebench 20 | |||
| Multi Core | 12874 | 14062 | 8.448% |
| Single Core | 869 | 754 | -15.252% |
| Cinebench 23 | |||
| Multi Core | 32924 | 35764 | 7.941% |
| Single Core | 2199 | 1990 | -10.503% |
| Geekbench 6 | |||
| Single | 3371 | 2680 | -25.784% |
| Multi | 20427 | 20926 | 2.385% |
| Geekbench AI | |||
| Single Precision | - | 5715 | - |
| Half Precision | - | 5734 | - |
| Quantized | - | 14098 | - |
| Geekbench AI (NPU) OpenVino | |||
| Single Precision | - | 5604 | - |
| Half Precision | - | 7731 | - |
| Quantized | - | 11817 | - |
| Geekbench AI (GPU) OpenVino | |||
| Single Precision | - | 5882 | - |
| Half Precision | - | 9166 | - |
| Quantized | - | 13465 | - |
| CPU-Z | |||
| Single | 862.2 | 872.8 | 1.214% |
| Multi | 13190 | 15734.6 | 16.172% |
| CPU Profile | |||
| Max Threads | 13965 | 16853 | 17.136% |
| 16 threads | 11018 | 14843 | 25.770% |
| 8 threads | 6442 | 9542 | 32.488% |
| 4 threads | 3812 | 4846 | 21.337% |
| 2 threads | 2492 | 2486 | -0.241% |
| 1 threads | 1281 | 1222 | -4.828% |
單核心表現的弱勢,在與 AMD Ryzen 9 9900X 比較之後,要更明顯許多。實際上,Cinebench 與 Geekbench 測試項目中,Intel Core Ultra 7 265K 也沒有明顯優勢存在,但 Intel Core Ultra 7 265K 在 CPU-Z 中的多核心表現,與 AMD Ryzen 9 9900X 有著明顯差距。
Overall - AMD Ryzen 9 9900X
| Overall | AMD Ryzen 9 9900X | Intel Core Ultra 7 265K | |
| PC Mark | |||
| Essential | 12479 | 10470 | -19.188% |
| Productivity | 13499 | 11290 | -19.566% |
| Digtal Content Creation | 19751 | 17765 | -11.179% |
| CrossMark | |||
| Overall | 2183 | 2034 | -7.325% |
| Productivity | 1941 | 1839 | -5.546% |
| Creativty | 2717 | 2516 | -7.989% |
| Responsiveness | 1610 | 1457 | -10.501% |
| Procyon office productivity | |||
| Overall | 8599 | 8069 | -6.568% |
| Word | 8445 | 8865 | 4.738% |
| Excel | 10422 | 8682 | -20.041% |
| PowerPoint | 8247 | 8045 | -2.511% |
| Outlook | 6600 | 5809 | -13.617% |
Intel Core Ultra 7 265K 明顯在綜合性測試表現不如 AMD Ryzen 9 9900X。
就如我們在 Intel Core Ultra 9 285K 測試中提到,Arrow Lake-S 的優勢在於功耗表現。我們在 Intel Core Ultra 7 265K 測試中,也觀察了這款處理器在 Cyberpunk 2077、Shadow of the Tomb Raider 以及 Counter-Strike 2 的處理器功耗,3 款遊戲平均功耗分別是 82.72W、71.5W 與 53.14W,與 Intel Core Ultra 9 285K 相比較的話,功耗要求都更低許多。
總結來說,雖然功耗表現與 Intel Core Ultra 9 285K 讓人驚艷,但從各種跑分數據來評估的話,Intel Core Ultra 7 265K 這款處理器的表現有點差強人意。
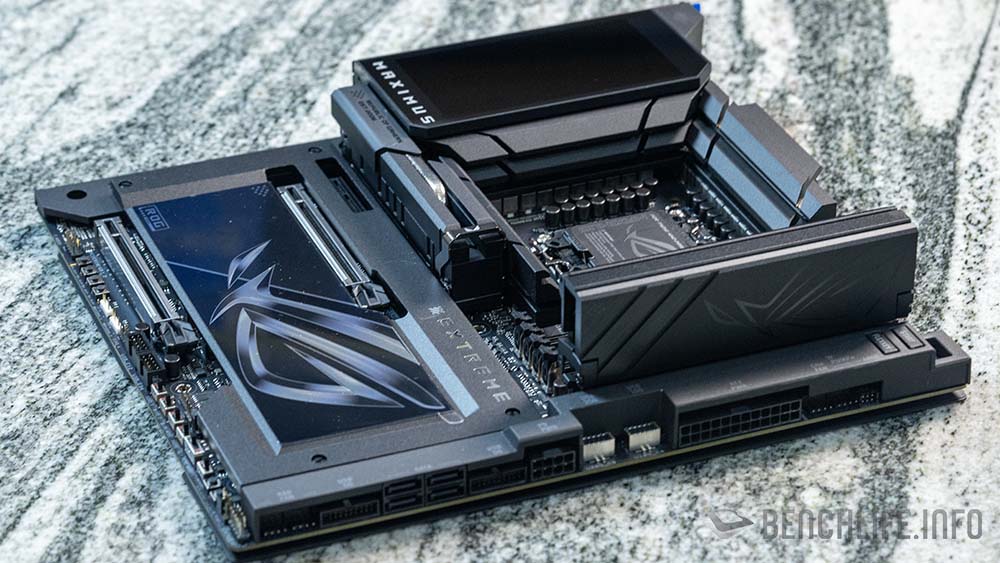
Arrow Lake-S 世代 Intel Core Ultra 9 285K、Core Ultra 7 265K 與 Core Ultra 5 245K 測試,使用的是 ASUS 提供的 ROG Maximus Z890 Extreme 主機板,更多關於 ROG Maximus Z890 Extreme 主機板的介紹,可以參考「旗艦級的 LGA 1851 腳位主機板,ASUS ROG Maximus Z890 Extreme 開箱」。記憶體部分為 DDR5-6400 MT/s CL36,而顯示卡部分為 NVIDIA GeForce RTX 4090 Founders Edition。