12 代 Core 旗艦處理器與 13 代 Core「K」系列處理器相互比較、實測。
代號 Raptor Lake-S 的 Intel 13 代 Core 系列處理器正式解禁,與 12 代 Core 沒有太大差異,Intel 一開始先推出高階的「K」系列處理器,爾後才會推出非「K」系列處理器滿足不同市場需求。
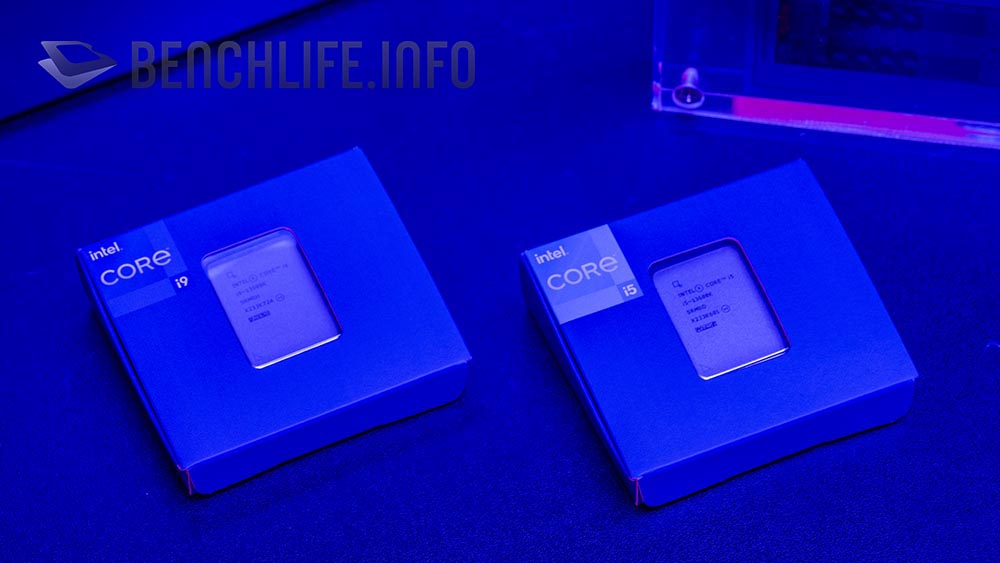
「K」與非「K」系列處理器主要差異在於是否能夠超頻,當然 Intel 的設定下,「K」系列處理器的時脈要較同級別的非「K」系列高。Intel 針對媒體部分提供了 Intel Core i9-13900K 與 Core i5-13600K 兩款處理器測試;不過,我們這篇文章的實測則是加入 Intel Core i7-13700K 一併進行。
Intel Core i9-13900K、Core i7-13700K 與 Core i5-13600K 比較表:
| Core i5-13600K | Core i7-13700K | Core i9-13900K | |
|---|---|---|---|
| Status | Launched | Launched | Launched |
| Launch | Q4'22 | Q4'22 | Q4'22 |
| Process | Intel 7 | Intel 7 | Intel 7 |
| Total Cores | 14 | 16 | 24 |
| Performance-cores | 6 | 8 | 8 |
| Efficient-cores | 8 | 8 | 16 |
| Total Threads | 20 | 24 | 32 |
| Max Turbo | 5.10 GHz | 5.40 GHz | 5.80 GHz |
| Performance-core Max Turbo | 5.10 GHz | 5.30 GHz | 5.40 GHz |
| Efficient-core Max Turbo | 3.90 GHz | 4.20 GHz | 4.30 GHz |
| Performance-core Base | 3.50 GHz | 3.40 GHz | 3.00 GHz |
| Efficient-core Base | 2.60 GHz | 2.50 GHz | 2.20 GHz |
| Intel Smart Cache | 24 MB | 30 MB | 36 MB |
| L2 Cache | 20 MB | 24 MB | 32 MB |
| Processor Base Power | 125 W | 125 W | 125 W |
| Max Turbo Power | 181 W | 253 W | 253 W |
| Thermal Velocity Boost | N/A | N/A | 5.80 GHz |
| Turbo Boost Max Technology 3.0 | N/A | 5.40 GHz | 5.70 GHz |
| Processor Graphics | Intel UHD Graphics 770 | Intel UHD Graphics 770 | Intel UHD Graphics 770 |
| Graphics Base | 300 MHz | 300 MHz | 300 MHz |
| Graphics Max Dynamic | 1.50 GHz | 1.60 GHz | 1.65 GHz |
| EU | 32 | 32 | 32 |
| DirectX | 12 | 12 | 12 |
| OpenGL | 4.5 | 4.5 | 4.5 |
| OpenCL | 3.0 | 3.0 | 3.0 |
| DMI | 4.0 | 4.0 | 4.0 |
| Max DMI Lanes | 8 | 8 | 8 |
| PCI Express | 5.0 and 4.0 | 5.0 and 4.0 | 5.0 and 4.0 |
| PCI Express Configurations | 1x 16 + 4 2x 8 + 4 | 1x 16 + 4 2x 8 + 4 | 1x 16 + 4 2x 8 + 4 |
| PCI Express Lanes | 20 | 20 | 20 |
| TJUNCTION | 100°C | 100°C | 100°C |
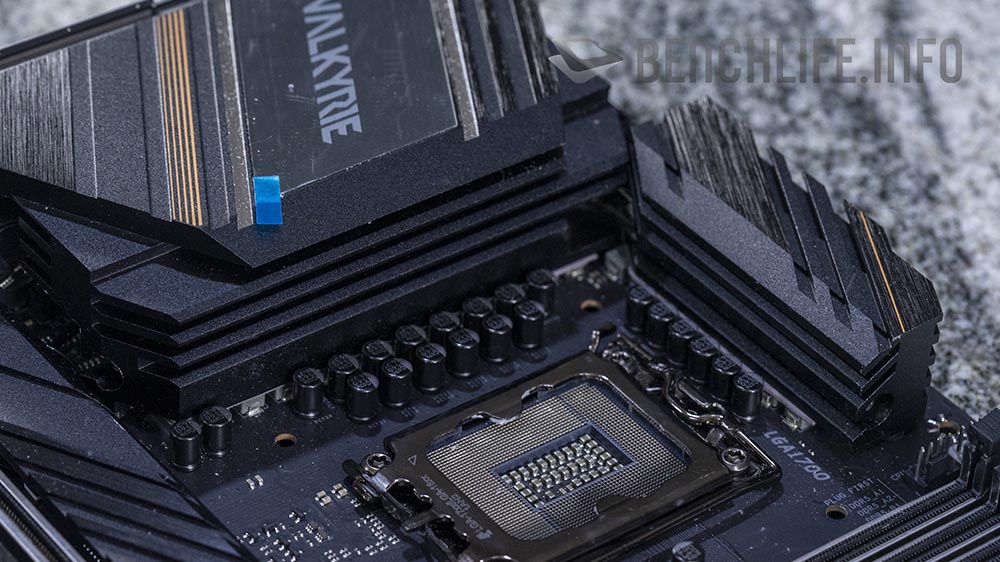
我們從代號 Alder Lake-S 的世代開始,迎來了 Performance-cores 與 Efficient-cores 整合的設計,當然我們也在代號 Raptor Lake-S 的 13 代 Core 見到相同設計。12 代 Core 系列處理器搭配 Intel Z690 晶片主機板,而 13 代 Core 則是搭配 Intel Z790 晶片主機板,兩者都採用 LGA1700 腳位,使用者可以使用 Intel Z790 晶片主機板搭配 12 代 Core 系列處理器,或是 13 代 Core 系列處理器搭配 Intel Z690 晶片主機板。
12 與 13 代 Core 系列處理器最顯著差異就是處理器核心數變多、核心時脈提升、快取增加,以及支援更高的記憶體時脈。
以旗艦的「K」系列處理器來說,Intel Core i9-12900K 核心數與執行緒分別是 16 核心 24 執行緒,而 Intel Core i9-13900K 為 24 核心 32 執行緒、5.4GHz 的 Max Turbo Performance Cores 與 4.3GHz 的 Max Turbo Efficient-cores 都高於 Intel Core i9-12900K 的 5.2GHz 與 3.9GHz 表現。
另一方面,5.8GHz 的 Max Turbo 與 Intel Thermal Velocity Boost 更勝於 5.2GHz 的 Intel Core i9-12900K,這可能都是使用者第一眼就能看出的差異。
也因為核心數與核心時脈的提升,Intel Core i9-13900K 的 Max Turbo Power 也從 241W 提升至 252W,但 Processor Base Power(TDP)依舊為 125W,不過我們不會在這篇文章針對這部分進行測試。此外,Intel Core i5-13600K 與 Core i7-13700K 的 Max Turbo Power(181W、253W vs 150W、190W)都有一定增加。
也可以發現到,核心數量有差異的 Intel Core i7-13700K 與 Intel Core i9-13900K 兩款處理器,其 Max Turbo Power 都是 253W。
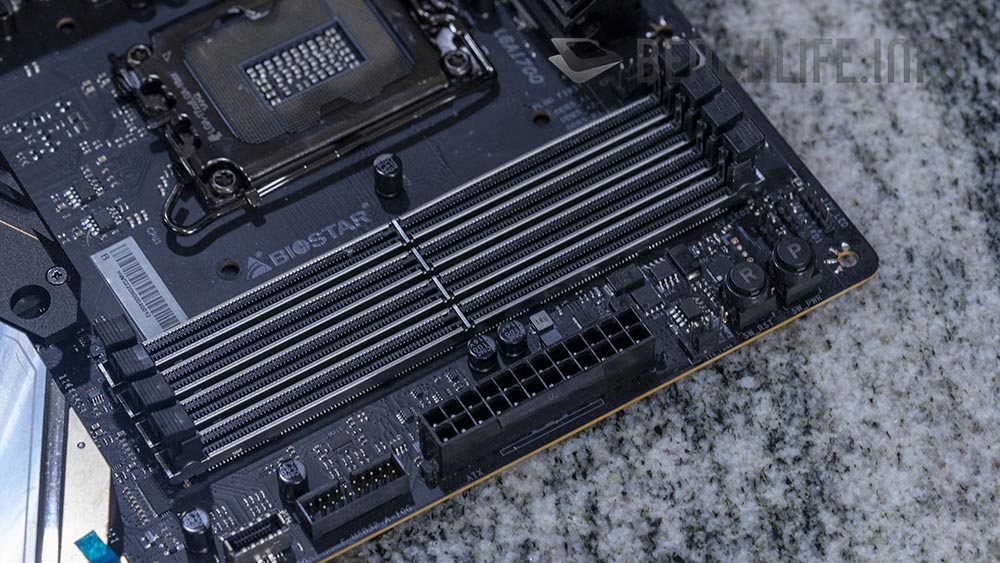
Intel 3 款處理器測試,與過去盡可能使用 ASUS、MSI 或是 GIGABYTE 不同的部分是,這次我們選擇 Biostar 的 Intel Z790 晶片主機板 – Z790 Valkyrie 進行測試。
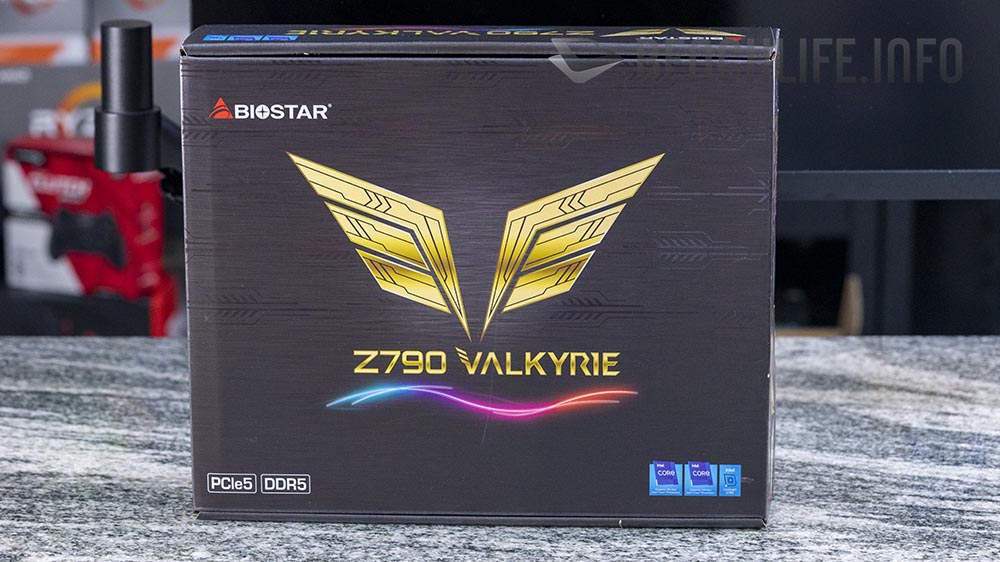
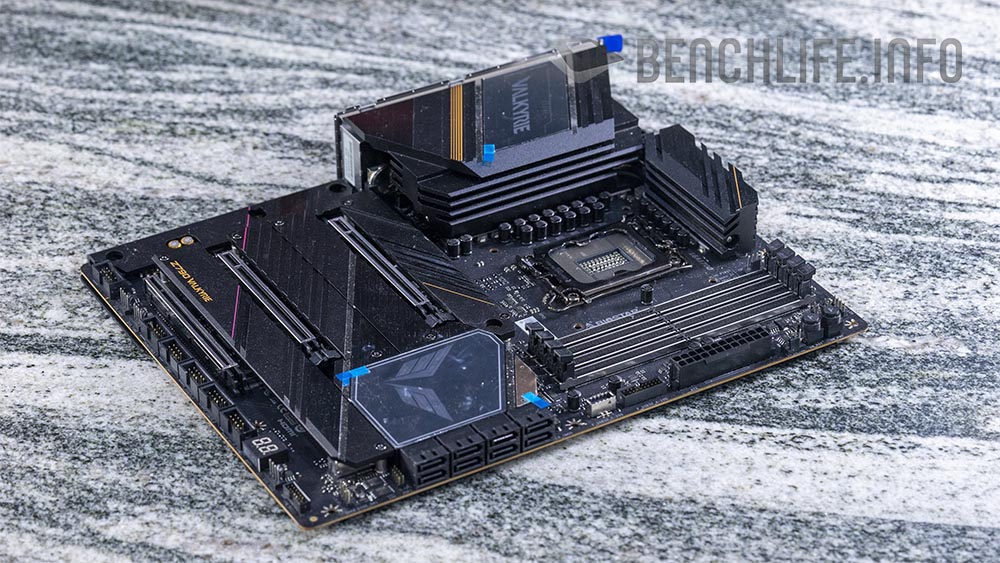
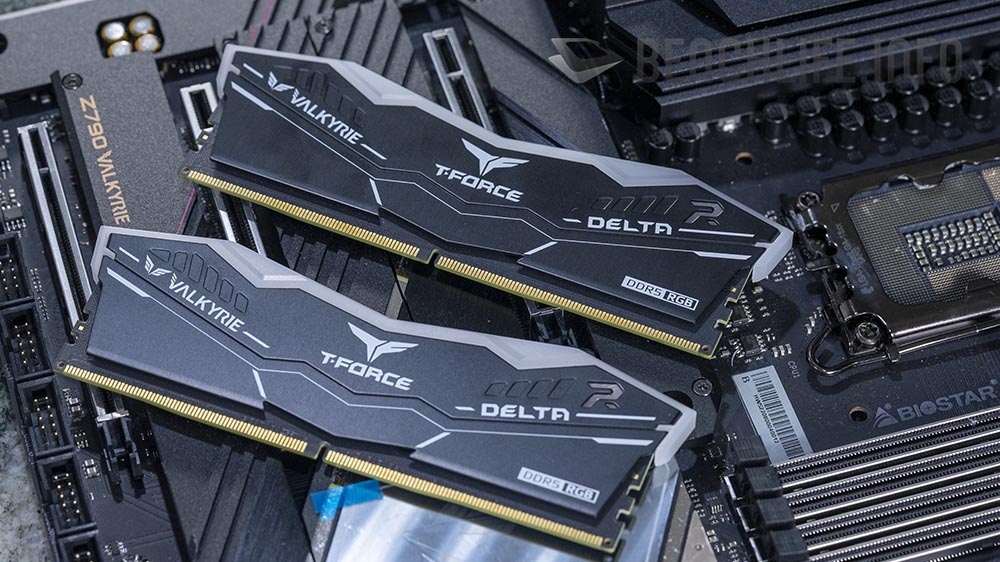
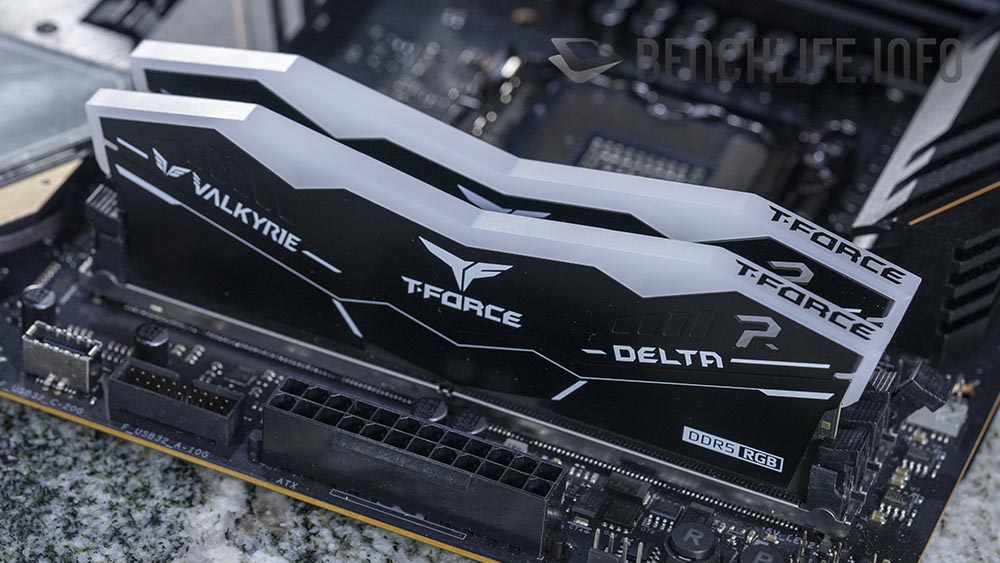
ATX 規格的 Biostar Z790 Valkyrie 採用 8 層 PCB 與 19 + 1 相供電設計(RAA2201054GNP, 105A + ISL99390FRZ, 90A)。作為 Biostar 的旗艦主機板,在記憶體規格上勢必以 DDR5 為主,畢竟 這已經是整個市場趨勢,而 Biostar 也與 Team Group 合作推出聯名記憶體搭配,我們這次測試就是使用相關記憶體。
Team Group x Valkyrie 的記憶體 XMP 參數為 DDR5-6000 MT/s CL38-38-38-78,電壓在 1.25V,我們手動調整至 DDR5-6400 MT/s CL40-40-40-76,1.40V 進行測試。
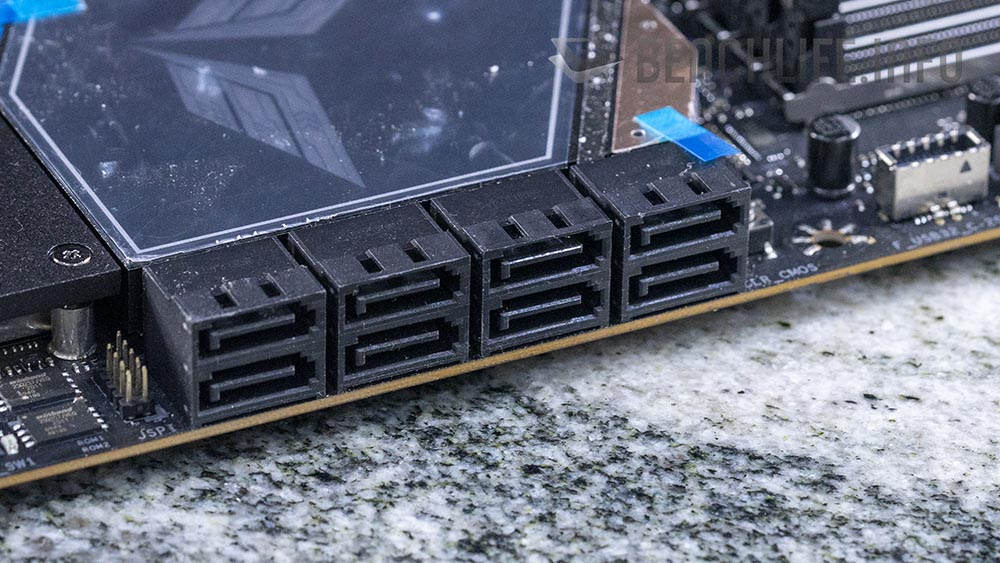
除了 DDR5 記憶體外,這張主機板還提供 PCIe 5.0 x16 插槽與 PCIe 5.0 x4 M.2 SSD 插槽,以及 8x SATA 6.0Gbps。
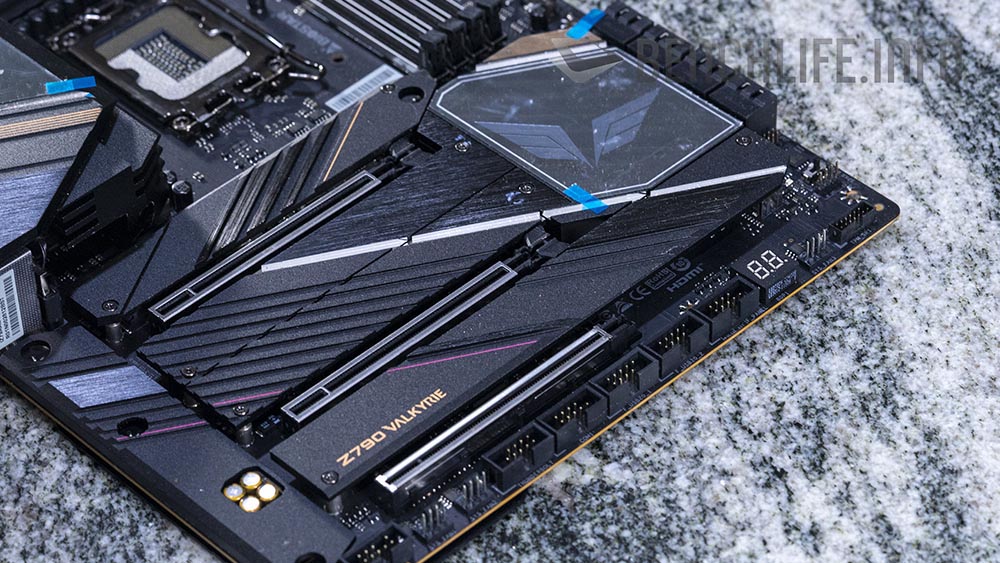
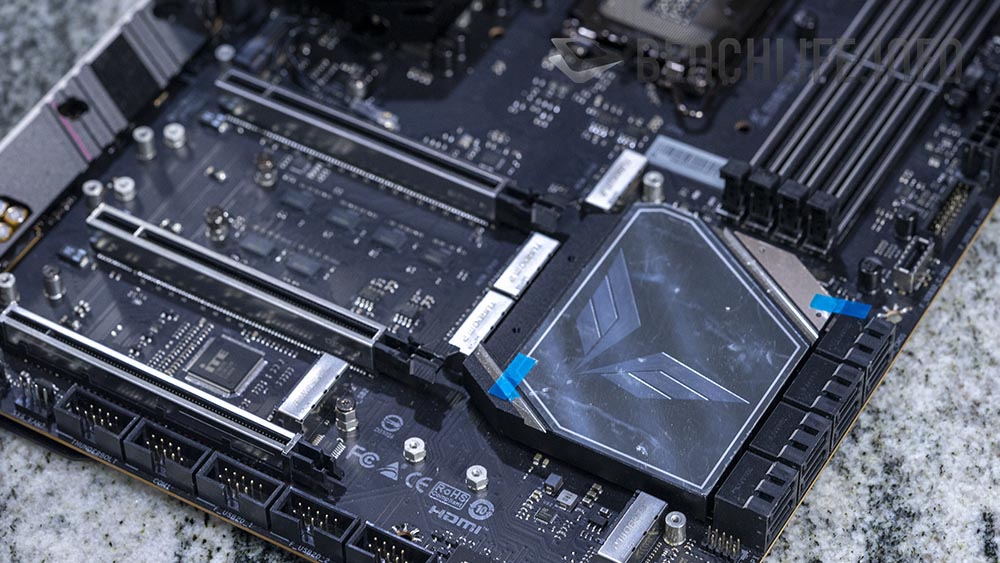
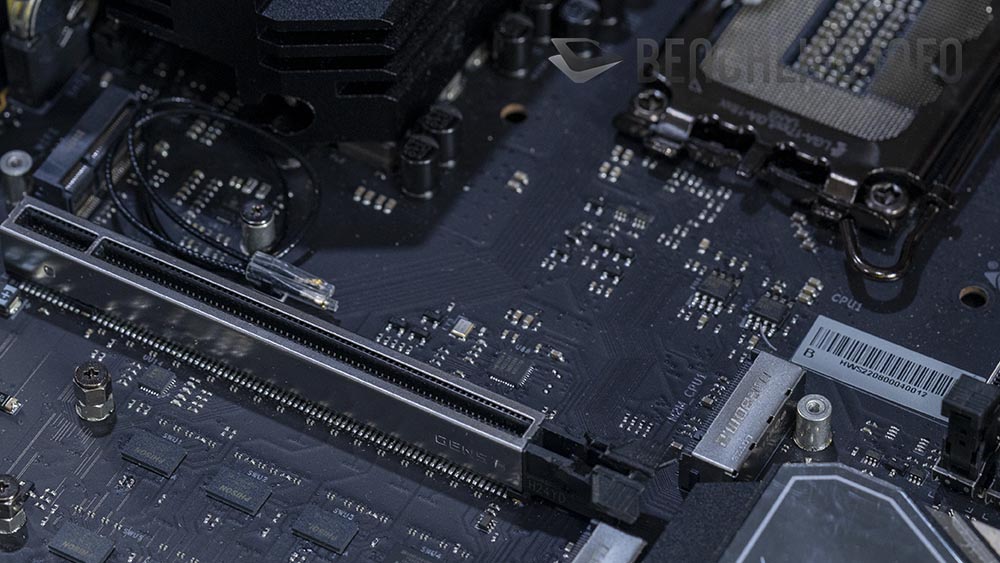
PCIe 插槽部分為 PCIe 5.0 x16、x16 與 PCIe 4.0 x16,其實際頻寬配置為 x16、x8 與 x4 配置;M.2 SSD 插槽多達 5 組,從最接近 CPU 到主機板最底部分別是 PCIe 5.0 x4、3x PCIe 4.0 x4 與 PCIe 3.0 與 SATA 6Gbps M.2 SSD 插槽。
Biostar Z790 Valkyrie 主機板的 I/O 配置提供了 HDMI 2.1、DisplayPort 1.4、Intel Wi-Fi 6E、2.5GbE LAN、2x USB 3.2 Gen2 x2(20Gb/s)Type-C 與 6 + 1 組 USB 3.2 Gen2 Type-A + Type-C 連接埠配置。
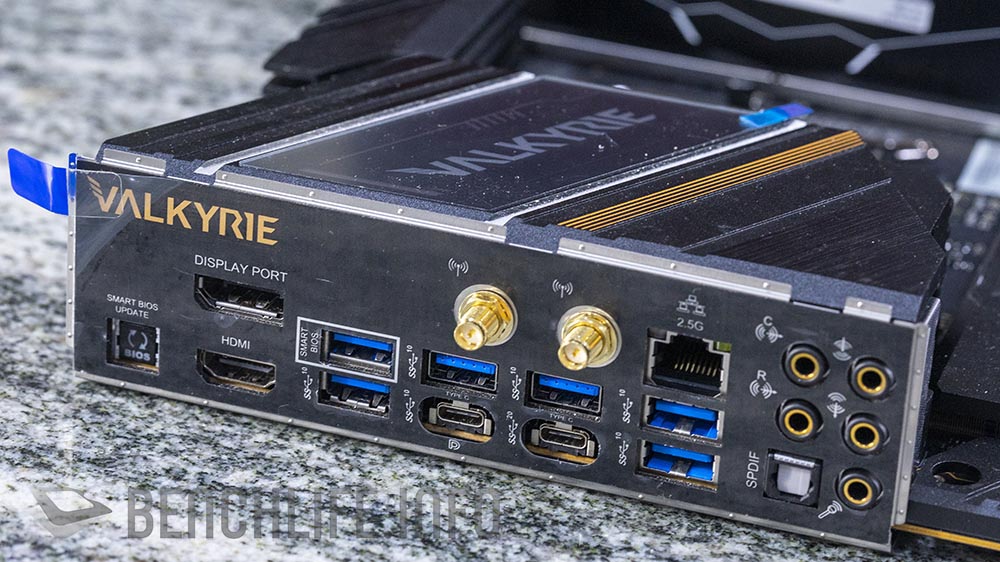
也需要特別注意,這次 Biostar Z790 Valkyrie 的其中一個 USB Type-C 連接埠是帶有輸出功能。
當然,Biostar Z790 Valkyrie 也能支援代號 Alder Lake-S 的 Intel 12 代 Core 系列處理器。
回到 Intel 13 代 Core 系列處理部分,這次要測試的有 Intel Core i9-13900K、Core i7-13700K 與 Core i5-13600K 在內的 3 款「K」系列處理器。在顯示卡部分,我們使用了 NVIDIA GeForce RTX 4090 Founders Edition 進行搭配,而記憶體部分則是 DDR5-6000 MT/s(超頻至 DDR5-6400 MT/s)。
測試是以 Alder Lake-S 的 Intel Core i9-12900K 作為基準點,分別針對 Intel Core i5-13600K、Core i7-13700K 與 Core i9-13900K 在多個項目分別進行比較。
Intel Core i5-13600K vs Intel Core i9-12900K:
| CPU Benchmark | Intel Core i9-12900K | Intel Core i5-13600K | |
|---|---|---|---|
| Cinebench R23 | |||
| Multi Core | 26995 | 23463 | -15.053% |
| Single Core | 1946 | 1969 | 1.168% |
| Cinebench R20 | |||
| Multi Core | 10258 | 9207 | -11.415% |
| Single Core | 733 | 770 | 4.805% |
| Geekbench | |||
| Single | 2012 | 1997 | -0.751% |
| Multi | 19363 | 17827 | -8.616% |
| CPU-Z | |||
| Single | 808.1 | 767.9 | -5.235% |
| Multi | 11400.2 | 9936.9 | -14.726% |
| Creators | Intel Core i9-12900K | Intel Core i5-13600K | |
|---|---|---|---|
| Blender | |||
| Monster | 197.4 | 171.9 | -14.834% |
| Junk Store | 117.3 | 103.9 | -12.897% |
| fishy_cat | 92.5 | 80.2 | -15.337% |
| Indigo Bench | |||
| Bedroom | 2.952 | 2.54 | -16.220% |
| Supercar | 8.257 | 7.306 | -13.017% |
| Vray | |||
| CPU | 18818 | 16515 | -13.945% |
| CrossMark | Intel Core i9-12900K | Intel Core i5-13600K | |
|---|---|---|---|
| overall | 2228 | 2231 | 0.134% |
| productivity | 1984 | 2007 | 1.146% |
| creativty | 2647 | 2591 | -2.161% |
| responsiveness | 1882 | 1955 | 3.734% |
| 3DMark | Intel Core i9-12900K | Intel Core i5-13600K | |
|---|---|---|---|
| TIme Spy | 32320 | 31890 | -1.348% |
| Graphic score | 36142 | 36480 | 0.927% |
| CPU score | 20212 | 18617 | -8.567% |
| Time Spy Extreme | 16638 | 15937 | -4.399% |
| Graphic score | 19275 | 19290 | 0.078% |
| CPU score | 9374 | 8030 | -16.737% |
| Fire Strike | 52618 | 52271 | -0.664% |
| Graphic score | 75983 | 83311 | 8.796% |
| Physics score | 40968 | 38784 | -5.631% |
| Combo score | 18273 | 15972 | -14.406% |
| Fire Strike Ultra | 38374 | 38358 | -0.042% |
| Graphic score | 45282 | 45573 | 0.639% |
| Physics score | 41644 | 38639 | -7.777% |
| Combo score | 16966 | 17450 | 2.774% |
| Fire Strike Extreme | 24439 | 24288 | -0.622% |
| Graphic score | 24692 | 24776 | 0.339% |
| Physics score | 41917 | 38029 | -10.224% |
| Combo score | 14357 | 14390 | 0.229% |
| Port Royal | 25670 | 25656 | -0.055% |
| Ray Tracing | 136.41 | 136.58 | 0.124% |
| CPU Profile | |||
| Max Threads | 11985 | 10119 | -18.441% |
| 16 threads | 10457 | 9817 | -6.519% |
| 8 threads | 7888 | 7238 | -8.980% |
| 4 threads | 4160 | 4293 | 3.098% |
| 2 threads | 2149 | 2186 | 1.693% |
| 1 thread | 1097 | 1099 | 0.182% |
| 1080p Gaming | Intel Core i9-12900K | Intel Core i5-13600K | |
|---|---|---|---|
| Assassin Creed Vahalla | 203 | 204 | 0.490% |
| Borderlands 3 : bad ass | 244.02 | 257.36 | 5.183% |
| Cyberpunk2077 | 208.28 | 223.86 | 6.960% |
| Tom Clancy’s The Division 2 | 275 | 262 | -4.962% |
| Metro Exodus | 180.77 | 194.82 | 7.212% |
| F1 22 | 236 | 261 | 9.579% |
| Far Cry 6 | 160 | 169 | 5.325% |
| Horizon Zero Dawn | 183 | 188 | 2.660% |
| Rainbow Six Siege | 638 | 636 | -0.314% |
| Shadow of the Tomb Raider (highest) | 254 | 269 | 5.576% |
| Total War: Troy | 273.2 | 292.1 | 6.470% |
| Watch Dog Legion | 162 | 164 | 1.220% |
| 1440p Gaming | Intel Core i9-12900K | Intel Core i5-13600K | |
|---|---|---|---|
| Assassin Creed Vahalla | 172 | 171 | -0.585% |
| Borderlands 3 : bad ass | 209.99 | 213.39 | 1.593% |
| Cyberpunk2077 | 151.29 | 162.19 | 6.721% |
| Tom Clancy’s The Division 2 | 220 | 263 | 16.350% |
| Metro Exodus | 172.95 | 181.19 | 4.548% |
| F1 22 | 231 | 240 | 3.750% |
| Far Cry 6 | 156 | 163 | 4.294% |
| Horizon Zero Dawn | 180 | 186 | 3.226% |
| Rainbow Six Siege | 628 | 604 | -3.974% |
| Shadow of the Tomb Raider (highest) | 250 | 265 | 5.660% |
| Total War: Troy | 228.5 | 243.4 | 6.122% |
| Watch Dog Legion | 154 | 156 | 1.282% |
| 4K Gaming | Intel Core i9-12900K | Intel Core i5-13600K | |
|---|---|---|---|
| Assassin Creed Vahalla | 113 | 113 | 0.000% |
| Borderlands 3 : bad ass | 118.31 | 129.84 | 8.880% |
| Cyberpunk2077 +RT+DLSS/FSR | 77.29 | 80.13 | 3.544% |
| Tom Clancy’s The Division 2 | 158 | 159 | 0.629% |
| Metro Exodus | 129.65 | 138.24 | 6.214% |
| F1 22 | 196 | 193 | -1.554% |
| Far Cry 6 | 131 | 133 | 1.504% |
| Horizon Zero Dawn | 152 | 156 | 2.564% |
| Rainbow Six Siege | 547 | 546 | -0.183% |
| Shadow of the Tomb Raider (highest) | 183 | 197 | 7.107% |
| Total War: Troy | 143 | 153 | 6.536% |
| Watch Dog Legion | 116 | 116 | 0.000% |
Intel Core i7-13700K vs Intel Core i9-12900K:
| CPU Benchmark | Intel Core i9-12900K | Intel Core i7-13700K | |
|---|---|---|---|
| Cinebench R23 | |||
| Multi Core | 26995 | 29897 | 9.707% |
| Single Core | 1946 | 2103 | 7.466% |
| Cinebench R20 | |||
| Multi Core | 10258 | 11539 | 11.101% |
| Single Core | 733 | 802 | 8.603% |
| Geekbench | |||
| Single | 2012 | 2087 | 3.594% |
| Multi | 19363 | 21111 | 8.280% |
| CPU-Z | |||
| Single | 808.1 | 851.3 | 5.075% |
| Multi | 11400.2 | 12624.1 | 9.695% |
| 3DMark | Intel Core i9-12900K | Intel Core i7-13700K | |
|---|---|---|---|
| TIme Spy | 32320 | 33289 | 2.911% |
| Graphic score | 36142 | 36373 | 0.635% |
| CPU score | 20212 | 22479 | 10.085% |
| Time Spy Extreme | 16638 | 17071 | 2.536% |
| Graphic score | 19275 | 19285 | 0.052% |
| CPU score | 9374 | 10345 | 9.386% |
| Fire Strike | 52618 | 56010 | 6.056% |
| Graphic score | 75983 | 80697 | 5.842% |
| Physics score | 40968 | 42562 | 3.745% |
| Combo score | 18273 | 19895 | 8.153% |
| Fire Strike Ultra | 38374 | 40578 | 5.432% |
| Graphic score | 45282 | 45635 | 0.774% |
| Physics score | 41644 | 42899 | 2.925% |
| Combo score | 16966 | 21222 | 20.055% |
| Fire Strike Extreme | 24439 | 24598 | 0.646% |
| Graphic score | 24692 | 24839 | 0.592% |
| Physics score | 41917 | 42661 | 1.744% |
| Combo score | 14357 | 14404 | 0.326% |
| Port Royal | 25670 | 25619 | -0.199% |
| Ray Tracing | 136.41 | 136.48 | 0.051% |
| CPU Profile | |||
| Max Threads | 11985 | 13035 | 8.055% |
| 16 threads | 10457 | 11479 | 8.903% |
| 8 threads | 7888 | 8344 | 5.465% |
| 4 threads | 4160 | 4392 | 5.282% |
| 2 threads | 2149 | 2250 | 4.489% |
| 1 thread | 1097 | 1152 | 4.774% |
| Creators | Intel Core i9-12900K | Intel Core i7-13700K | |
|---|---|---|---|
| Blender | |||
| Monster | 197.4 | 216.1 | 8.653% |
| Junk Store | 117.3 | 129.6 | 9.491% |
| fishy_cat | 92.5 | 101 | 8.416% |
| Indigo Bench | |||
| Bedroom | 2.952 | 3.254 | 9.281% |
| Supercar | 8.257 | 9.221 | 10.454% |
| Vray | |||
| CPU | 18818 | 20769 | 9.394% |
| CrossMark | Intel Core i9-12900K | Intel Core i7-13700K | |
|---|---|---|---|
| overall | 2228 | 2349 | 5.151% |
| productivity | 1984 | 2073 | 4.293% |
| creativty | 2647 | 2805 | 5.633% |
| responsiveness | 1882 | 2012 | 6.461% |
| 1080p Gaming | Intel Core i9-12900K | Intel Core i7-13700K | |
|---|---|---|---|
| Assassin Creed Vahalla | 203 | 202 | -0.495% |
| Borderlands 3 : bad ass | 244.02 | 264.16 | 7.624% |
| Cyberpunk2077 | 208.28 | 210.45 | 1.031% |
| Tom Clancy’s The Division 2 | 275 | 290 | 5.172% |
| Metro Exodus | 180.77 | 197.01 | 8.243% |
| F1 22 | 236 | 259 | 8.880% |
| Far Cry 6 | 160 | 163 | 1.840% |
| Horizon Zero Dawn | 183 | 197 | 7.107% |
| Rainbow Six Siege | 638 | 711 | 10.267% |
| Shadow of the Tomb Raider (highest) | 254 | 293 | 13.311% |
| Total War: Troy | 273.2 | 280.4 | 2.568% |
| Watch Dog Legion | 162 | 160 | -1.250% |
| 1440p Gaming | Intel Core i9-12900K | Intel Core i7-13700K | |
|---|---|---|---|
| Assassin Creed Vahalla | 172 | 172 | 0.000% |
| Borderlands 3 : bad ass | 209.99 | 216.09 | 2.823% |
| Cyberpunk2077 | 151.29 | 159.35 | 5.058% |
| Tom Clancy’s The Division 2 | 220 | 263 | 16.350% |
| Metro Exodus | 172.95 | 187.06 | 7.543% |
| F1 22 | 231 | 237 | 2.532% |
| Far Cry 6 | 156 | 161 | 3.106% |
| Horizon Zero Dawn | 180 | 196 | 8.163% |
| Rainbow Six Siege | 628 | 623 | -0.803% |
| Shadow of the Tomb Raider (highest) | 250 | 281 | 11.032% |
| Total War: Troy | 228.5 | 242 | 5.579% |
| Watch Dog Legion | 154 | 158 | 2.532% |
| 4K Gaming | Intel Core i9-12900K | Intel Core i7-13700K | |
|---|---|---|---|
| Assassin Creed Vahalla | 113 | 120 | 5.833% |
| Borderlands 3 : bad ass | 118.31 | 129.66 | 8.754% |
| Cyberpunk2077 | 77.29 | 79.6 | 2.902% |
| Tom Clancy’s The Division 2 | 158 | 157 | -0.637% |
| Metro Exodus | 129.65 | 137.44 | 5.668% |
| F1 22 | 196 | 193 | -1.554% |
| Far Cry 6 | 131 | 133 | 1.504% |
| Horizon Zero Dawn | 152 | 158 | 3.797% |
| Rainbow Six Siege | 547 | 546 | -0.183% |
| Shadow of the Tomb Raider (highest) | 183 | 196 | 6.633% |
| Total War: Troy | 143 | 154 | 7.143% |
| Watch Dog Legion | 116 | 113 | -2.655% |
Intel Core i9-13900K vs Intel Core i9-12900K:
| CPU Benchmark | Intel Core i9-12900K | Intel Core i9-13900K | |
|---|---|---|---|
| Cinebench R23 | |||
| Multi Core | 26995 | 38100 | 29.147% |
| Single Core | 1946 | 2148 | 9.404% |
| Cinebench R20 | |||
| Multi Core | 10258 | 14998 | 31.604% |
| Single Core | 733 | 833 | 12.005% |
| Geekbench | |||
| Single | 2012 | 2187 | 8.002% |
| Multi | 19363 | 25887 | 25.202% |
| CPU-Z | |||
| Single | 808.1 | 921.5 | 12.306% |
| Multi | 11400.2 | 16906.9 | 32.571% |
| Creators | Intel Core i9-12900K | Intel Core i9-13900K | |
|---|---|---|---|
| Blender | |||
| Monster | 197.4 | 280.9 | 29.726% |
| Junk Store | 117.3 | 168.2 | 30.262% |
| fishy_cat | 92.5 | 127.4 | 27.394% |
| Indigo Bench | |||
| Bedroom | 2.952 | 4.143 | 28.747% |
| Supercar | 8.257 | 12.195 | 32.292% |
| Vray | |||
| CPU | 18818 | 26818 | 29.831% |
| CrossMark | Intel Core i9-12900K | Intel Core i9-13900K | |
|---|---|---|---|
| overall | 2228 | 2438 | 8.614% |
| productivity | 1984 | 2145 | 7.506% |
| creativty | 2647 | 2910 | 9.038% |
| responsiveness | 1882 | 2106 | 10.636% |
* 3DMark 數據中的 FireStrike 系列有落差,我們會在後續更新這部分數據
| 3DMark | Intel Core i9-12900K | Intel Core i9-13900K | |
|---|---|---|---|
| TIme Spy | 32320 | 33594 | 3.792% |
| Graphic score | 36142 | 36186 | 0.122% |
| CPU score | 20212 | 23895 | 15.413% |
| Time Spy Extreme | 16638 | 18051 | 7.828% |
| Graphic score | 19275 | 19198 | -0.401% |
| CPU score | 9374 | 13488 | 30.501% |
| Fire Strike | 52618 | 46096 | -14.149% |
| Graphic score | 75983 | 61500 | -23.550% |
| Physics score | 40968 | 54964 | 25.464% |
| Combo score | 18273 | 14772 | -23.700% |
| Fire Strike Ultra | 38374 | 24514 | -56.539% |
| Graphic score | 45282 | 24317 | -86.215% |
| Physics score | 41644 | 55020 | 24.311% |
| Combo score | 16966 | 13843 | -22.560% |
| Fire Strike Extreme | 24439 | 24406 | -0.135% |
| Graphic score | 24692 | 24251 | -1.818% |
| Physics score | 41917 | 54914 | 23.668% |
| Combo score | 14357 | 13671 | -5.018% |
| Port Royal | 25670 | 25529 | -0.552% |
| Ray Tracing | 136.41 | 136.15 | -0.191% |
| CPU Profile | |||
| Max Threads | 11985 | 16937 | 29.238% |
| 16 threads | 10457 | 12102 | 13.593% |
| 8 threads | 7888 | 8783 | 10.190% |
| 4 threads | 4160 | 4660 | 10.730% |
| 2 threads | 2149 | 2387 | 9.971% |
| 1 thread | 1097 | 1235 | 11.174% |
| 1080p Gaming | Intel Core i9-12900K | Intel Core i9-13900K | |
|---|---|---|---|
| Assassin Creed Vahalla | 203 | 204 | 0.490% |
| Borderlands 3 : bad ass | 244.02 | 278.31 | 12.321% |
| Cyberpunk2077 | 208.28 | 237.86 | 12.436% |
| Tom Clancy’s The Division 2 | 275 | 246 | -11.789% |
| Metro Exodus | 180.77 | 196.3 | 7.911% |
| F1 22 | 236 | 266 | 11.278% |
| Far Cry 6 | 160 | 184 | 13.043% |
| Horizon Zero Dawn | 183 | 200 | 8.500% |
| Rainbow Six Siege | 638 | 736 | 13.315% |
| Shadow of the Tomb Raider (highest) | 254 | 290 | 12.414% |
| Total War: Troy | 273.2 | 286.3 | 4.576% |
| Watch Dog Legion | 162 | 175 | 7.429% |
| 1440p Gaming | Intel Core i9-12900K | Intel Core i9-13900K | |
|---|---|---|---|
| Assassin Creed Vahalla | 172 | 171 | -0.585% |
| Borderlands 3 : bad ass | 209.99 | 230.77 | 9.005% |
| Cyberpunk2077 | 151.29 | 161.06 | 6.066% |
| Tom Clancy’s The Division 2 | 220 | 256 | 14.063% |
| Metro Exodus | 172.95 | 182.18 | 5.066% |
| F1 22 | 231 | 242 | 4.545% |
| Far Cry 6 | 156 | 176 | 11.364% |
| Horizon Zero Dawn | 180 | 191 | 5.759% |
| Rainbow Six Siege | 628 | 715 | 12.168% |
| Shadow of the Tomb Raider (highest) | 250 | 281 | 11.032% |
| Total War: Troy | 228.5 | 242 | 5.579% |
| Watch Dog Legion | 154 | 163 | 5.521% |
| 4K gaming | Intel Core i9-12900K | Intel Core i9-13900K | |
|---|---|---|---|
| Assassin Creed Vahalla | 113 | 117 | 3.419% |
| Borderlands 3 : bad ass | 118.31 | 129.71 | 8.789% |
| Cyberpunk2077 | 77.29 | 79.62 | 2.926% |
| Tom Clancy’s The Division 2 | 158 | 157 | -0.637% |
| Metro Exodus(RT_high) | 129.65 | 136.43 | 4.970% |
| F1 22 | 196 | 194 | -1.031% |
| Far Cry 6 | 131 | 134 | 2.239% |
| Horizon Zero Dawn | 152 | 158 | 3.797% |
| Rainbow Six Siege | 547 | 544 | -0.551% |
| Shadow of the Tomb Raider (highest) | 183 | 197 | 7.107% |
| Total War: Troy | 143 | 148.6 | 3.769% |
| Watch Dog Legion | 116 | 115 | -0.870% |
整篇測試的最後,來看看 3 款 Raptor Lake-S 的 K 系列處理器在 Sysmark 的表現差異。
| Sysmark | Intel Core i5-13600K | Intel Core i7-13700K | Intel Core i9-13900K |
|---|---|---|---|
| Productivity | 2025 | 2072 | 2116 |
| Creativity | 2382 | 2552 | 2782 |
| Responsiveness | 1474 | 1494 | 1299 |
| Overall Rating | 2075 | 2162 | 2219 |
Raptor Lake-S 是由 Performance Core 的 Raptor Cove 核心與 Efficient Core 的 Gracemont 核心組成,製程部分使用的是與 Alder Lake-S 相同的 Intel 7 技術。
如我們前面所述,Alder Lake-S 的 12 代 Core 處理器與 Raptor Lake-S 的 13 代 Core 處理器的主要差異:
1. 核心數增加;
2. L2 + L3 Cache 提升;
3. 原生 DDR5-5600 MT/s 記憶體支援;
4. 額外 PCH PCIe 4.0 通道;
PCIe 5.0 頻寬開始從 12 代 Core 系列處理器與 Intel Z690 晶片主機板支援,這部分也在 Intel Z790 晶片主機板與 13 代 Core 系列處理器上見到,只是對於 PCIe 5.0 x4 M.2 SSD 的「原生」支援,依舊無法在這一世代產品上見到。
話雖如此,各家主機板廠在 Intel Z790 晶片主機板上自行提供 PCIe 5.0 x4 M.2 SSD 的插槽,方便玩家自行升級使用。
當然,這也使額外增加的 PCIe 5.0 x4 M.2 SSD 則是成為大部分 Intel Z790 晶片主機板的「新」功能,讓它與舊有的 Intel Z690 晶片主機板有所不同。
代號 Raptor Lake-S 的 Intel 第 13 代 Core 系列處理器效能表現都要較 12 代 Core 系列處理器佳(如果不行的話,那到底出來幹嘛)。以 Intel Core i5-13600K 的表現,雖然在多核心方面仍落後 Intel Core i9-12900K 最多 15%,但搭配 GeForce RTX 4090 Founders Edition 顯示卡在 1080p、1440p 與 4K 解析度下,遊戲表現基本上與 Intel Core i9-12900K 沒有太大差異。
Intel Core i7-13700K 與 Intel Core i9-13900K 就不需要做太多解釋,整體表現都較 Intel Core i9-12900K 與 GeForce RTX 4090 Founders Edition + DDR5-6400 MT/s 配置好許多。
現行使用 Intel Core i9-12900K 的使用者是否需要升級,預算充足的條件下,升級至 Intel Core i9-13900K 可能是個不錯的選項,因為你的 Intel Z690 晶片主機板可以透過更新 BIOS 方式支援 Raptor Lake-S 處理器,可以省下一筆更換主機板的費用。
換換病發作想要更換主機板也不是問題,因為主機板廠會因為這樣而感謝你,但我們會建議將主機板的預算省下來,將顯示卡升級至 GeForce RTX 4090,會是一個相當不錯的升級方向。
推薦閱讀
- 可以把 Core i9-12900K 換掉了,Intel Core i9-13900K、Core i7-13700K 與 Core i5-13600K 實測
- Intel Core i9-13900K 搭 MSI MPG Z790 Carbon WiFi 實測
- Intel Core i5-13600K 搭 ASUS ROG Strix Z790-E Gaming WiFi 實測
- GIGABYTE Z790 AORUS Master 搭 Intel Core i9-13900K 實測體驗