第 14 代 Intel Core 桌上型處理器來了,如你所知處理器的架構與製程並未改變,也維持搭配 700 系列晶片組主機板,來瞧瞧這微妙的改朝換代,以及搭配 ROG Maximus Z790 Dark Hero 實測表現。
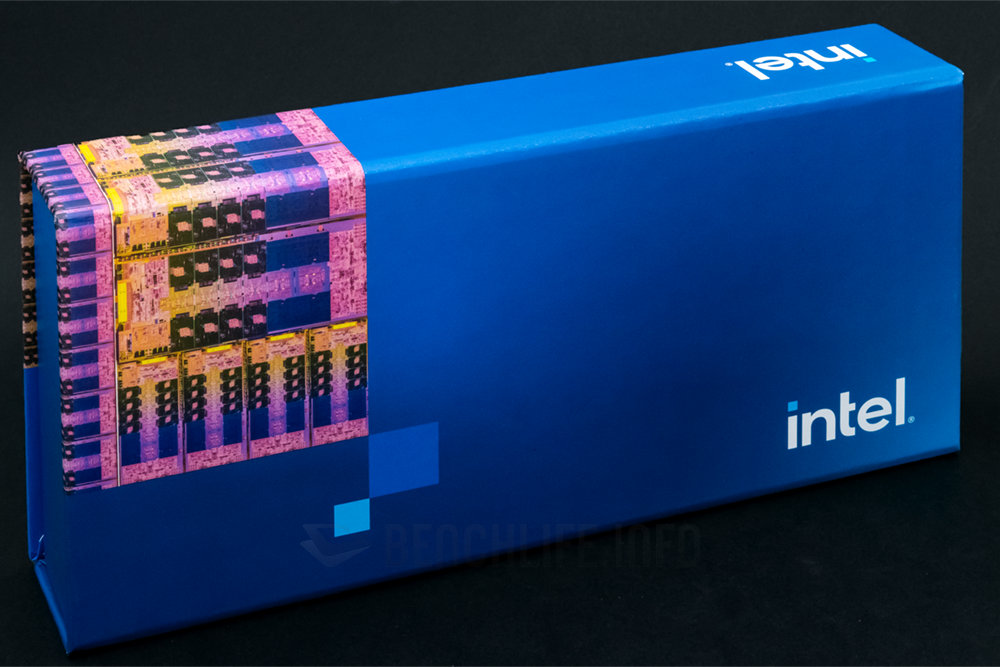
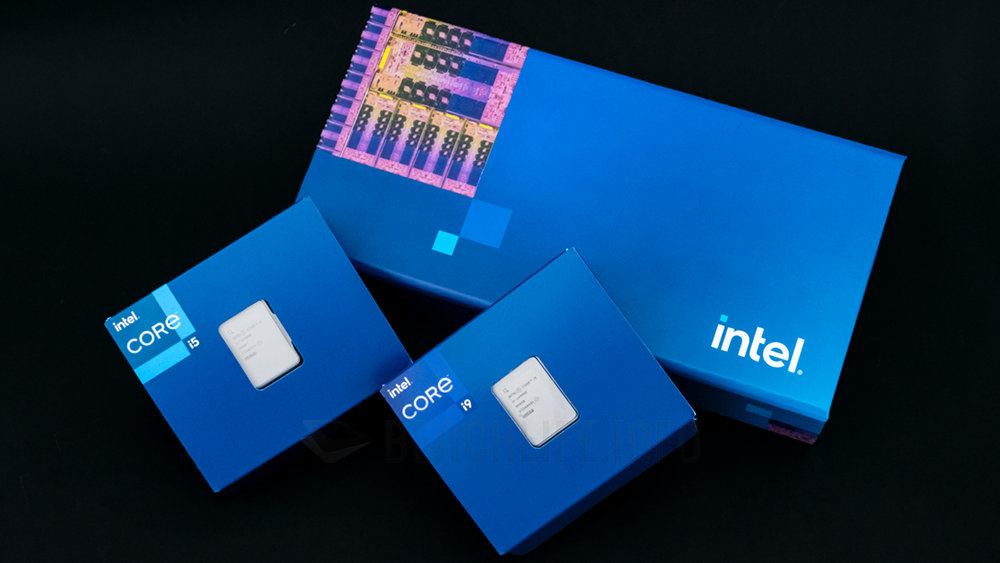
延續最近幾代媒體測試樣品的作法,Intel 為 14 代 Intel Core 桌上型處理器設計了獨特包裝,那主視覺和 13 代樣品相仿,Intel 招牌藍色紙盒印製著晶片透視圖。
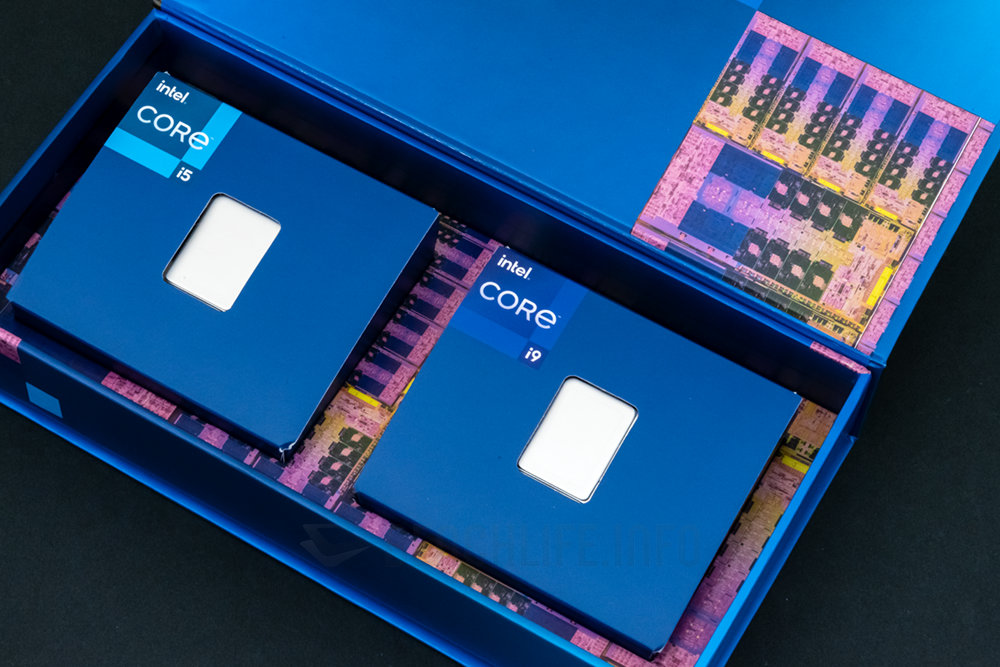
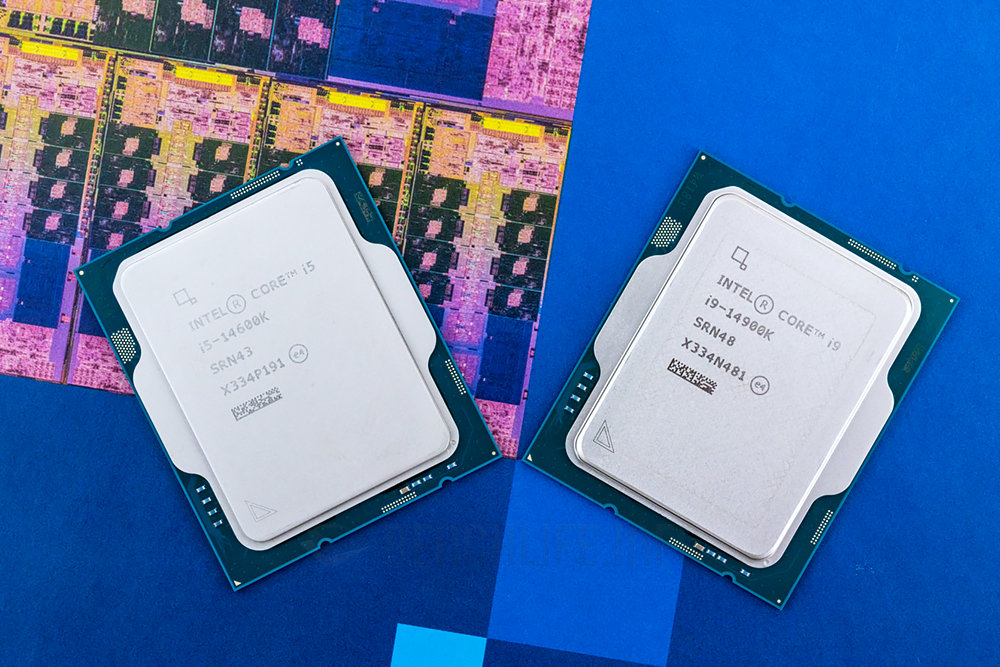
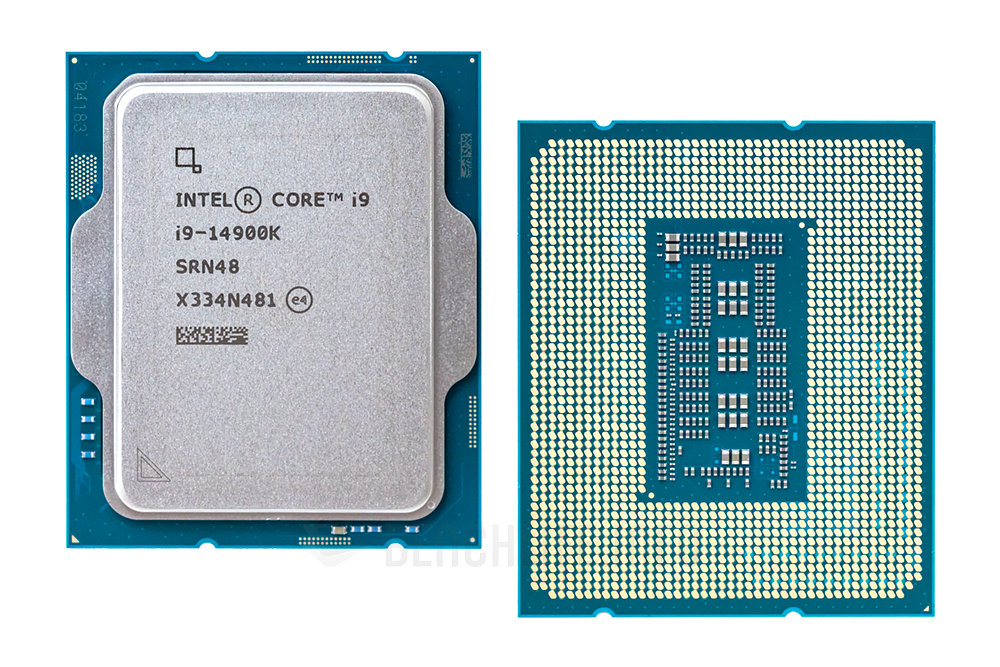
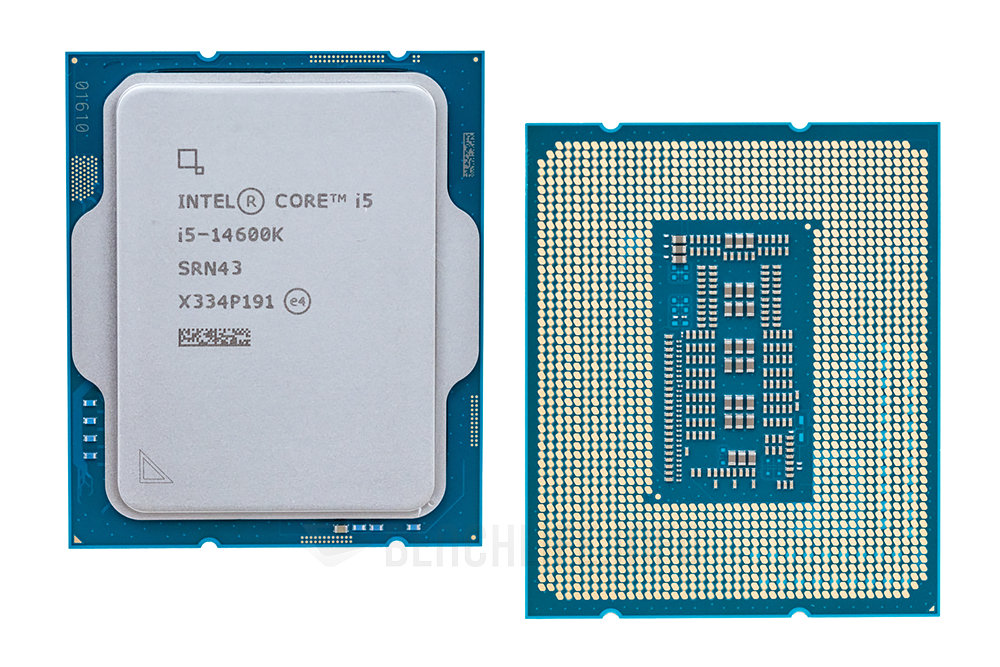
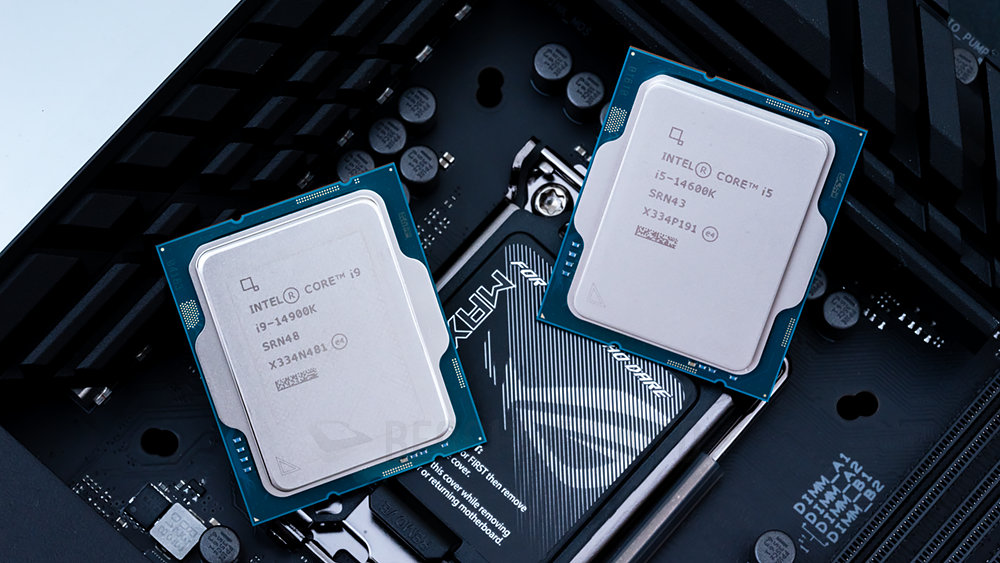
Intel 一貫提供高階、主打產品,想當然耳也會是 K 版不鎖頻款式,Core i9-14900K 與 Core i5-14600K 靜默躺在獨特包裝盒內,後續將和前代同級產品實測比較。
14 代 Intel Core 桌上型處理器
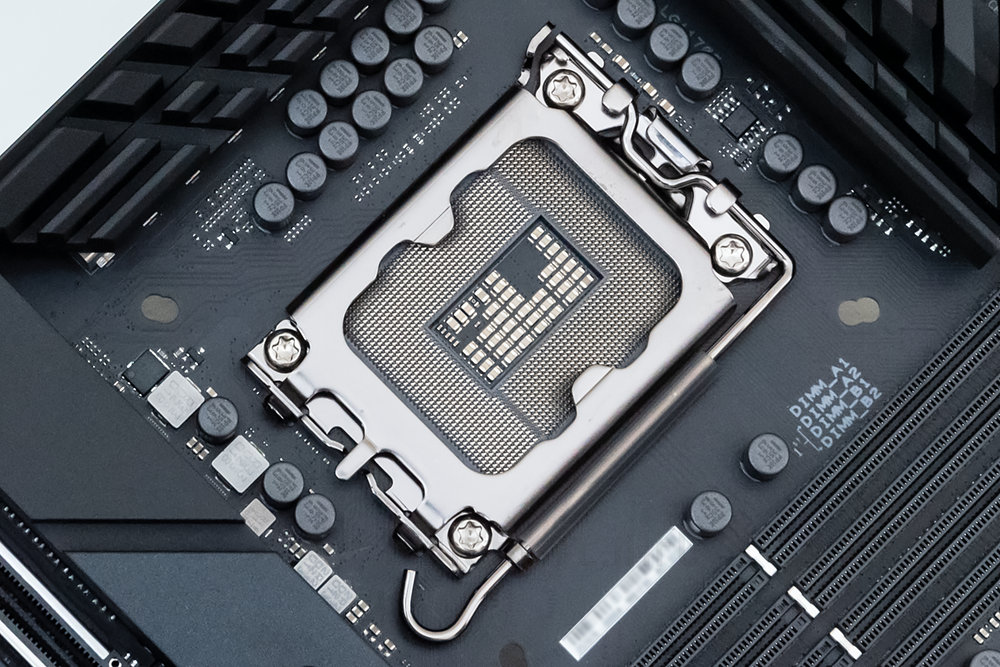
第 12、13、14 代 Intel Core 桌上型處理器擁有相同 DNA,作為始祖的第 12 代(代號 Alder Lake)首度採用效能混合架構設計,包含全新 LGA 1700 腳位、600 系列晶片組。
而第 13(代號 Raptor Lake)、14 代(代號 Raptor Lake Refresh)都是它的延伸,第 13 代推出時還新帶來 700 系列晶片組,至於第 14 代則是維持既有配套措施。
藉由 Refresh 微更新再戰一年的第 14 代,相對好處是相容於 600、700 系列晶片組主機板,各代之間可以無痛交叉搭配使用,主機板廠也有跟著推出一些更新產品。
就這次的樣品來講,Core i9-14900K 與 Core i9-13900K、Core i5-14600K 和 Core i5-13600K 之間的關聯式,新品都是預設時脈再往上拉,第 14 代產品線大致上也如此(僅 Core i7-14700K / KF 還多增加 4 個 E-core)。
Core i9-14900K 時脈最高達 6GHz(P-Core、Intel TVB 模式、1~2 核),不過 6GHz 標的先前已經由 Core i9-13900KS 達成,Core i9-14900K 則具有其他略高的加速時脈(Intel Turbo Boost 等)。
Core i5-14600K 同理,Intel 仍未下放 Intel TVB、Intel Turbo Boost Max Technology 3.0 等技術,除了 Intel Turbo Boost 加速時調高至 5.3GHz(P-core),包含 E-core、基礎時脈也都略高於前代。
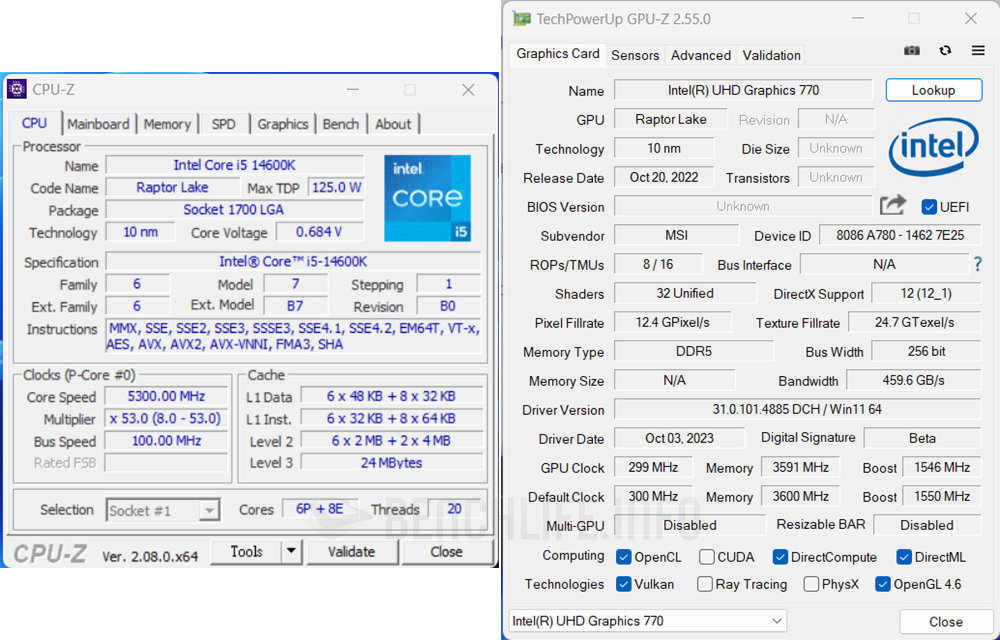
當然有些人虧 Intel 更新都靠「電」上去的,也就是犧牲功耗來換取性能,Core i9-14900K 和 Core i5-14600K 基礎功耗同為 125W、加速功耗分別是 253W、181W,片面而言是維持和前代相同標準。
| 處理器簡要規格 | i9-14900K | i9-13900KS | i9-13900K | i9-12900K | i5-14600K | i5-13600K | i5-12600K |
|---|---|---|---|---|---|---|---|
| 核心數量 | 24C / 32T | 24C / 32T | 24C / 32T | 16C / 24T | 14C / 20T | 14C / 20T | 10C / 16T |
| P-core 數量 | 8 | 8 | 8 | 8 | 6 | 6 | 6 |
| E-core 數量 | 16 | 16 | 16 | 8 | 8 | 8 | 4 |
| Smart Cache | 36MB | 36MB | 36MB | 30MB | 24MB | 24MB | 20MB |
| L2 Cache | 32MB | 32MB | 32MB | 14MB | 20MB | 20MB | 9.5MB |
| Intel TVB | 6.0GHz | 6.0GHz | 5.8GHz | - | - | - | - |
| ITBM 3.0 | 5.8GHz | 5.8GHz | 5.7GHz | 5.2GHz | - | - | - |
| P-core ITB | 5.6GHz | 5.4GHz | 5.4GHz | 5.1 GHz | 5.3GHz | 5.1GHz | 4.9GHz |
| E-core ITB | 4.4GHz | 4.3GHz | 4.3GHz | 3.9GHz | 4.0GHz | 3.9GHz | 3.6GHz |
| P-core 基礎時脈 | 3.2GHz | 3.2GHz | 3.0GHz | 3.2GHz | 3.5GHz | 3.5GHz | 3.7GHz |
| E-core基礎時脈 | 2.4GHz | 2.4GHz | 2.2GHz | 2.4GHz | 2.6GHz | 2.6GHz | 2.8GHz |
| 基礎功耗 | 125W | 150W | 125W | 125W | 125W | 125W | 125W |
| 加速功耗 | 253W | 253W | 253W | 241W | 181W | 181W | 150W |
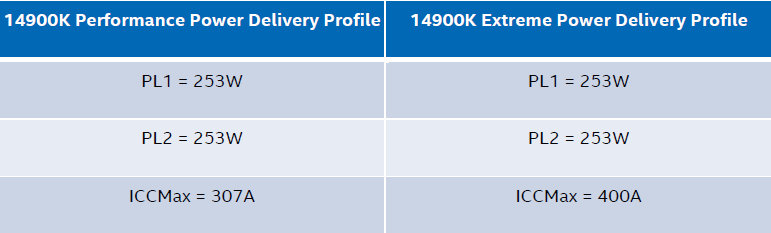
那麼還有什麼新鮮事?Intel 另外加入了 Extreme Power Delivery Profile,作用是指定處理器的 ICCMax 電流量供應上限新策略,完全餵飽處理器所需有利於提高性能。
不過 Intel 目前只為 Core i9-14900K / KF 提供 307A 和 400A 組態,使用上也得視散熱器性能(Intel 建議至少使用 360mm AIO 水冷),以及主機板廠的實際設置而定。
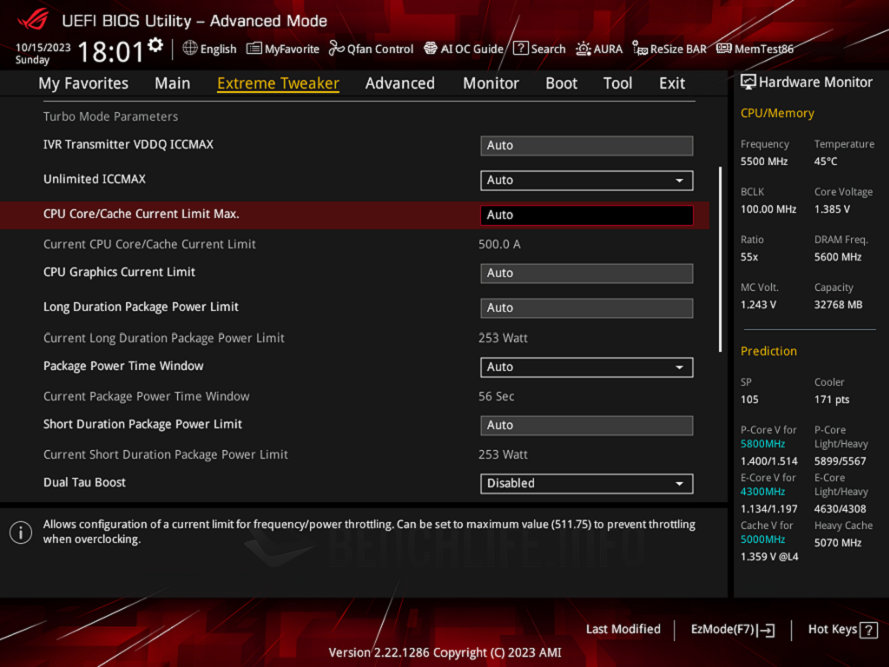
圖例 ASUS ROG Maximus Z790 Dark Hero 的 ICCMax 選項預設為 500A。
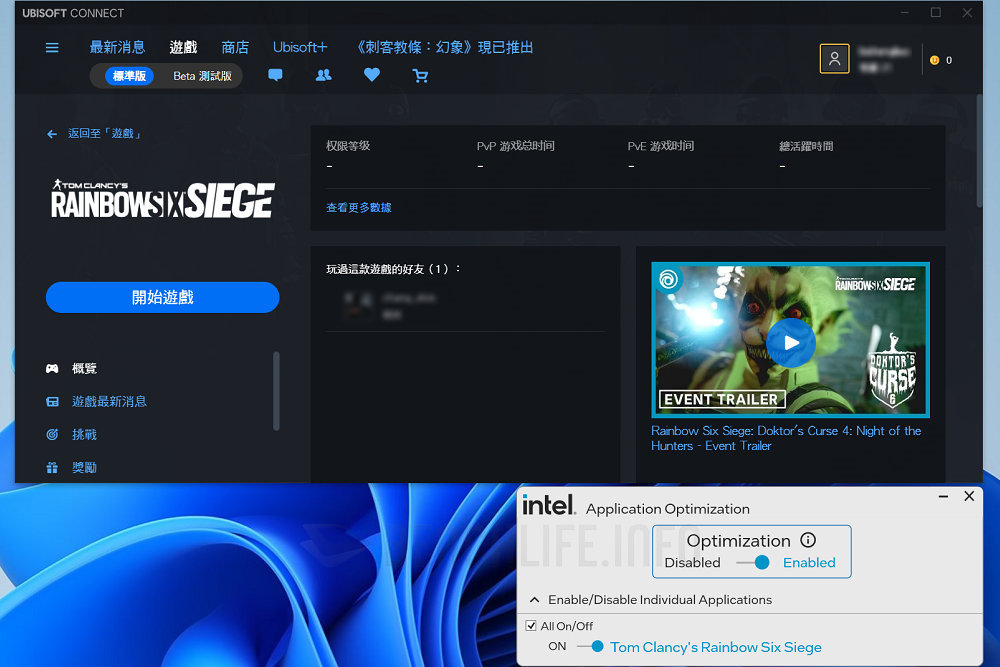
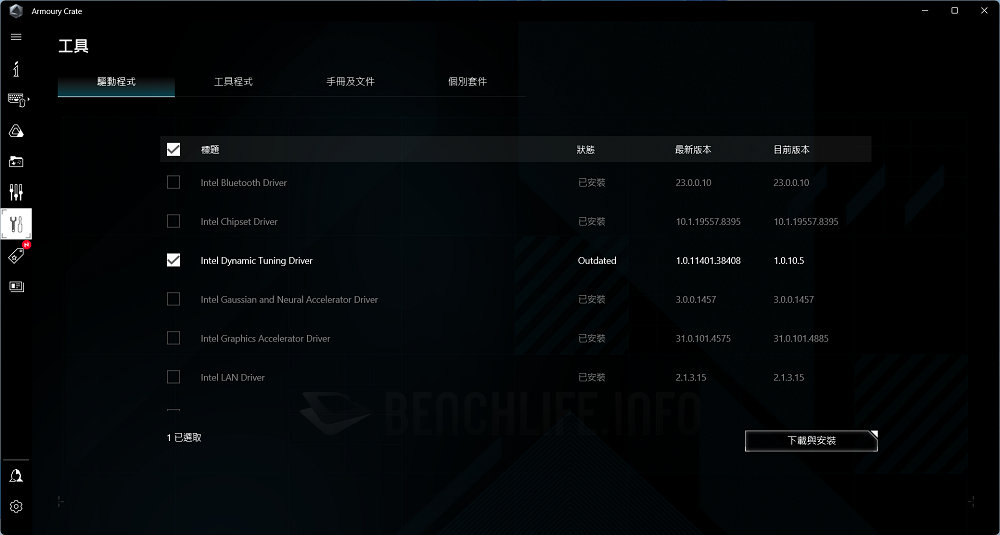
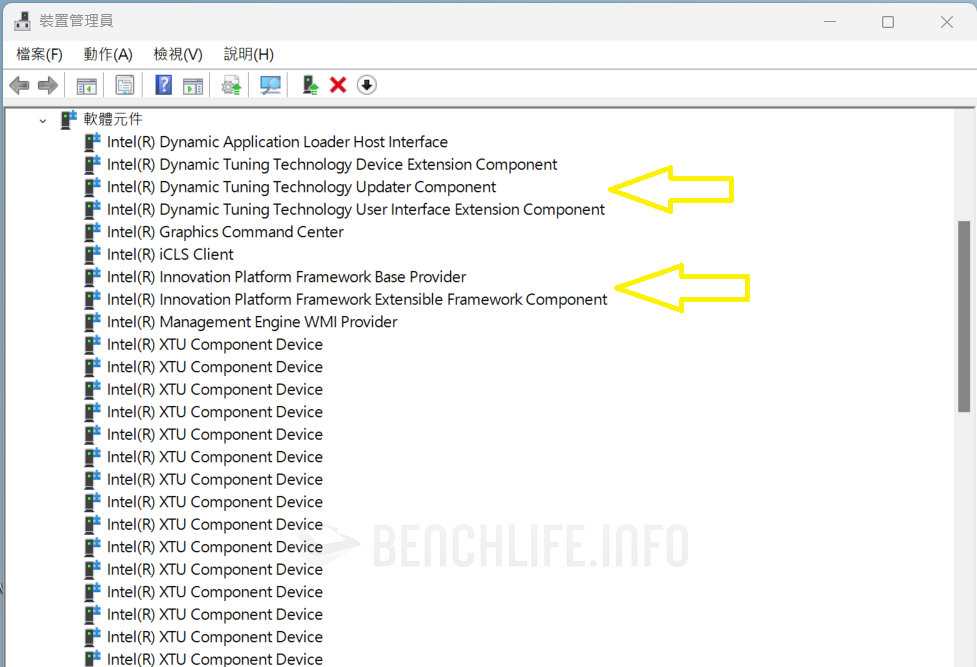
Intel 在韌、軟體層還有一些作為,包含 Intel Application Optimization(Intel APO)和 Intel Dynamic Tuning Technology(Intel DTT)等功能,只不過當下限定支援 Core i9-14900K / KF,就看 Intel 後續是否願意下放給所有 K 版不鎖頻處理器。
Intel Application Optimization 作用大意上來說,可以進一步最佳化 Intel Thread Director 執行緒調度 / 排程,使用它必須同時開啟 Intel DTT 功能。而且存在軟體相容性、支援程度限制,Intel 指出當前有 Rainbow 6 Siege、Metro Exodus 這 2 款遊戲支援,效益是能夠提高畫面幀數(FPS)。
Intel Dynamic Tuning Technology(Intel DTT)則是源自 Intel Adaptix 的技術,讓系統製造商能透過軟體 / 驅動程式層,針對產品自訂熱量 / 功率最佳化等策略。這項功能過往常見行動平臺搭載,Intel 醞釀導入到主機板應該也有段時間,一般使用者是沒有去修改、調整的必要(相關選項看了也只是黑人問號… …)。
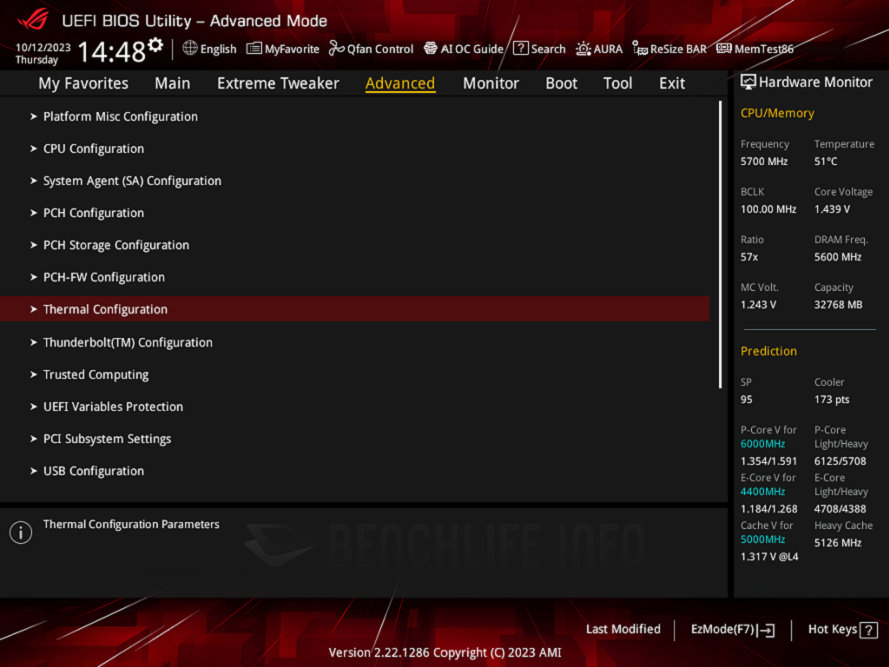
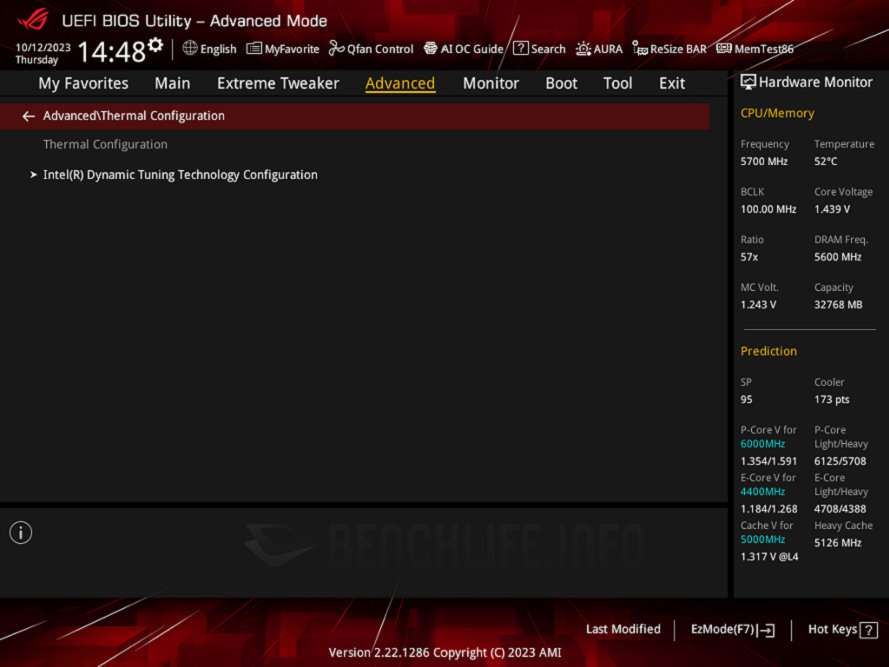
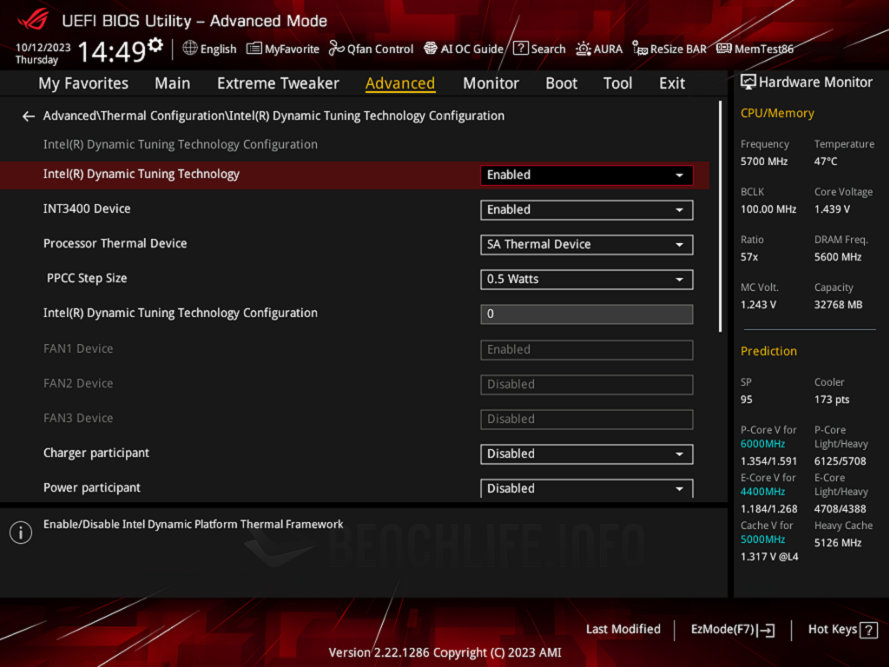
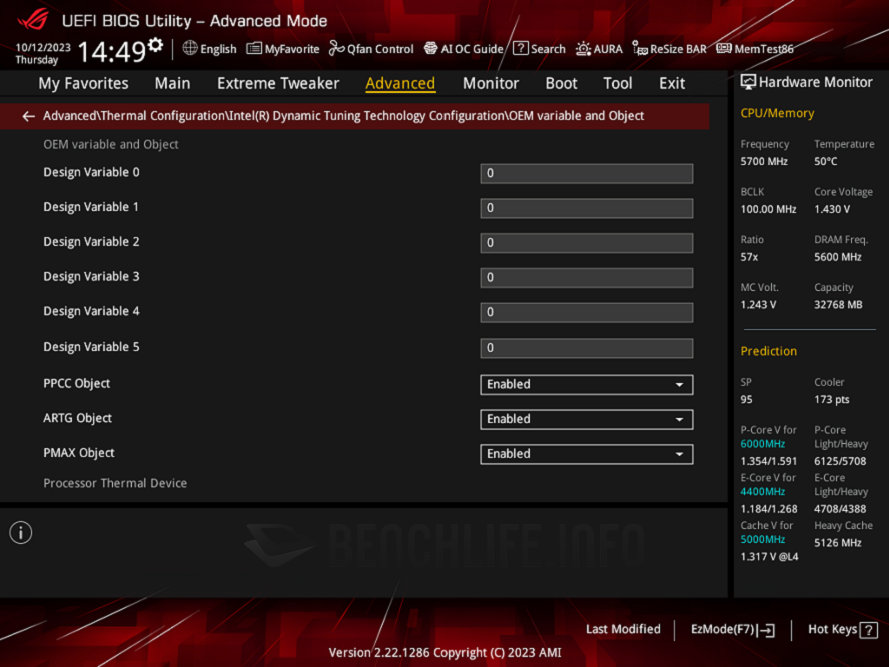
圖例 ASUS ROG Maximus Z790 Dark Hero 的 UEFI BIOS 內 Intel DTT 設定選項(Advanced > Thermal Configuration)。
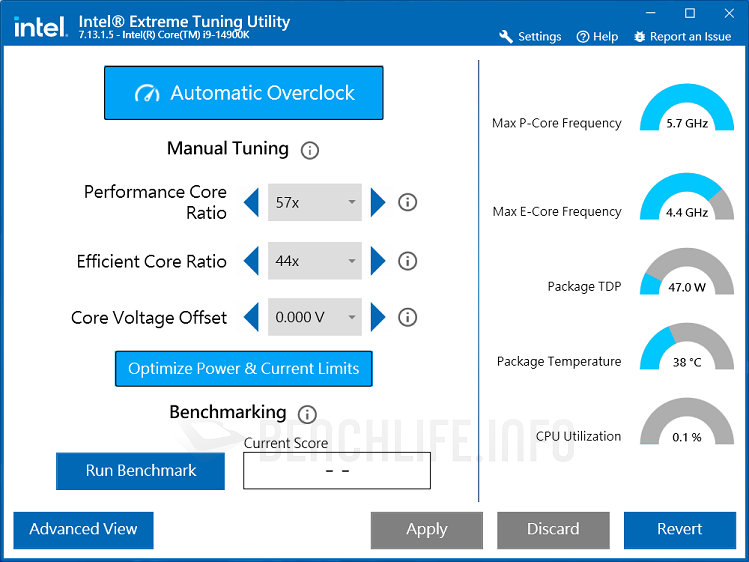
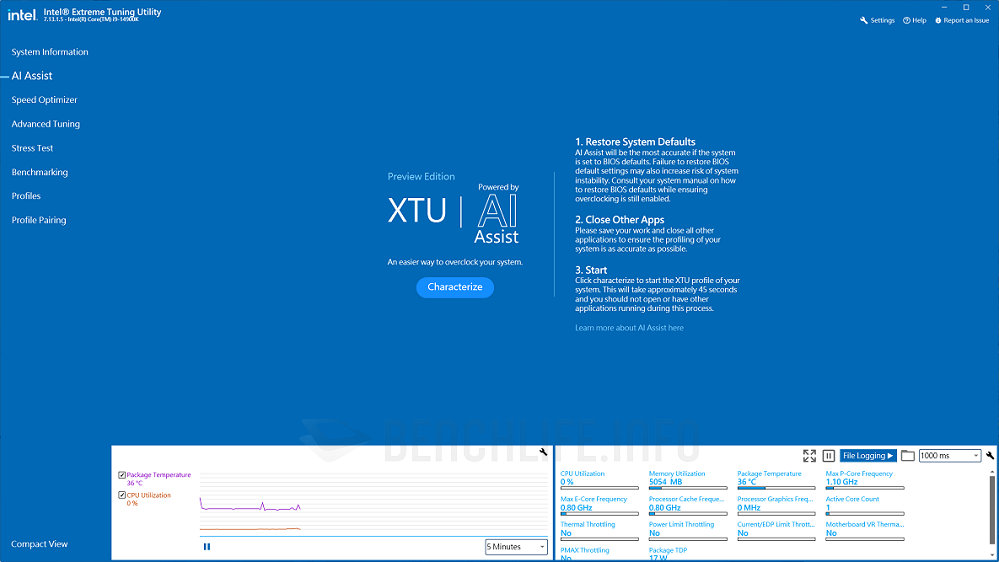
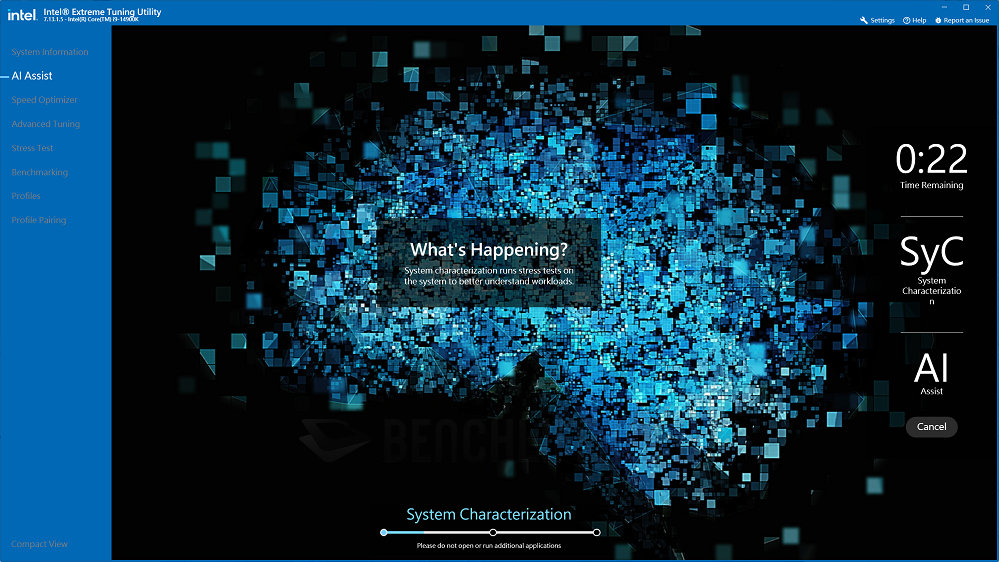
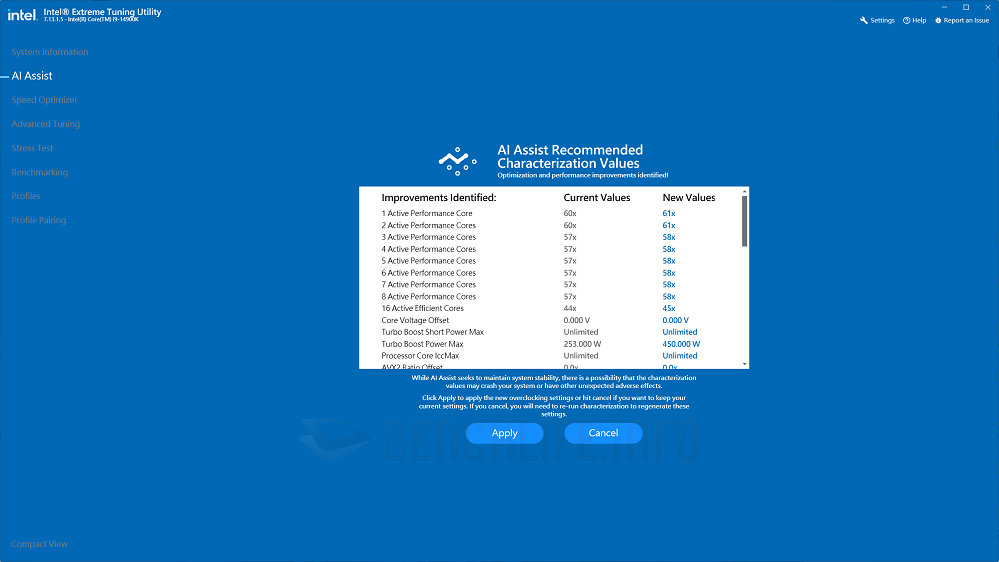
Intel 在評測指南也提到 Intel AI Assist,這是內建於 Intel Extreme Tuning Utility 軟體的新功能,當下也僅限支援 Core i9-14900K / KF。這是透過 AI 人工智慧模型 / 大數據分析統計方式,進一步發揮處理器超頻潛力,亦可視為 Speed Optimizer 功能的 AI 版。

由於處理器骨子裡相同,就不八百萬字長篇贅述架構兩三事,可以參考先前舊品的相關介紹。那麼在晶片組搭配部分,既有 600 與 700 系列的主機板,更新 UEFI BIOS 即可獲得支援。
主機板廠也針對 700 系列產品進行 Refresh,稍早之前的開箱介紹提到,今年度開始導入 Wi-Fi 7 無線網路,可看到使用 Intel Wi-Fi 7 BE200 / BE202,或是來自 Qualcomm、MediaTek 的模組產品。
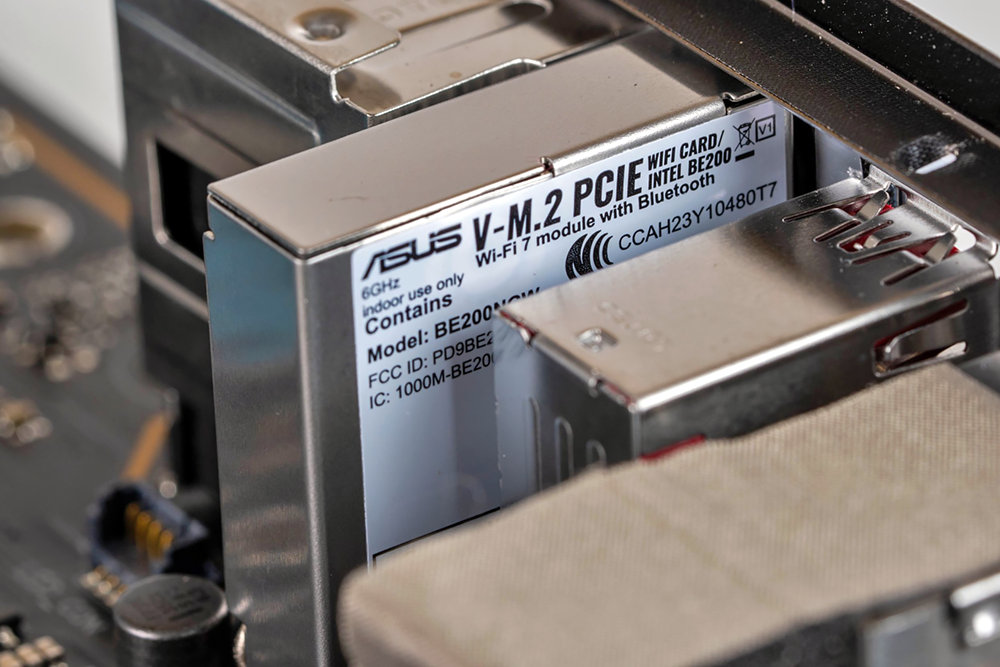
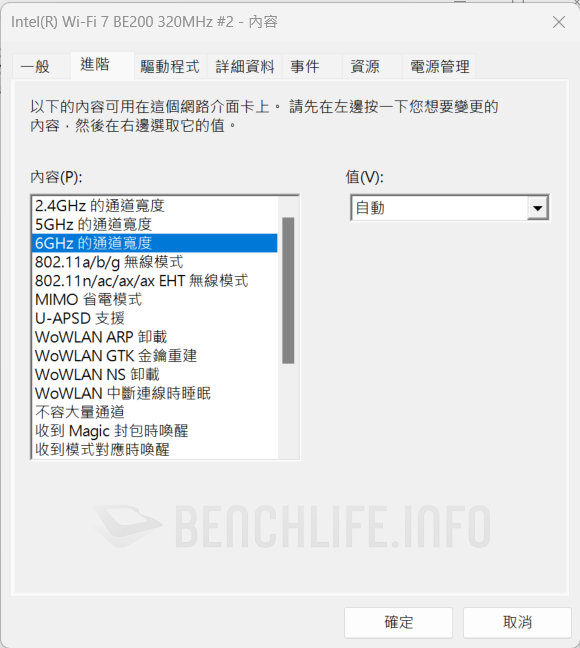
當然了,這些都屬於 Wi-Fi 7 Pre-cerified 產品,演進步調如同當年 Wi-Fi 6 那樣。Wi-Fi 7 支援 2.4 / 5 / 6GHz 頻段、320MHz 頻寬,前述模組基於 2 x 2 天線配置,最高傳輸速率達 5.8Gbps(Wi-Fi 6E / 6 為 2.4Gbps)。
圖例 ASUS ROG Maximus Z790 Dark Hero 是搭配 Intel Wi-Fi 7 BE200 無線網路模組。
就現實而言,主機板對於運作組態的主導權,是凌駕在前述部分 Intel 重點訴求之上(ICCMax、Power Limit、… …)。儘管 Core i9-14900K / KF 獨享那些功能,但可用性與設定值主要由主機板決定,不諱言「真實」使用的差異可能有那麼點無感。
ROG Maximus Z790 Dark Hero
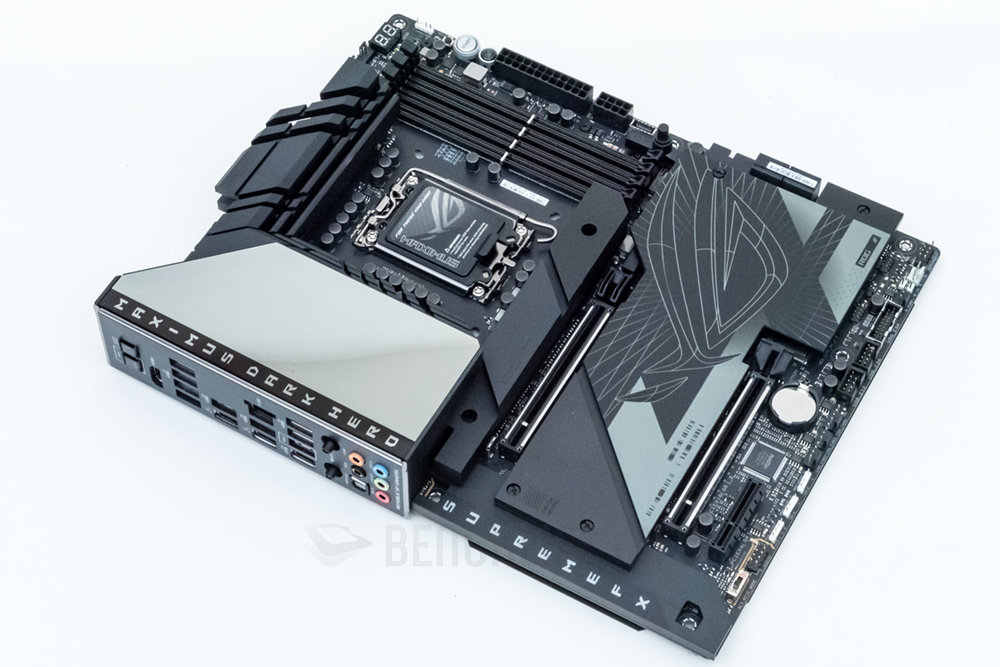
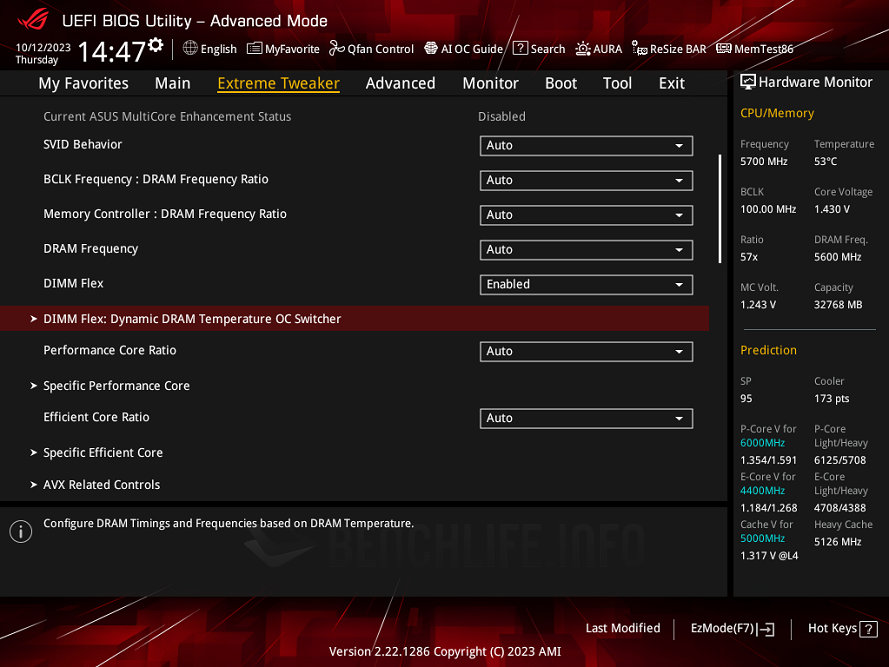
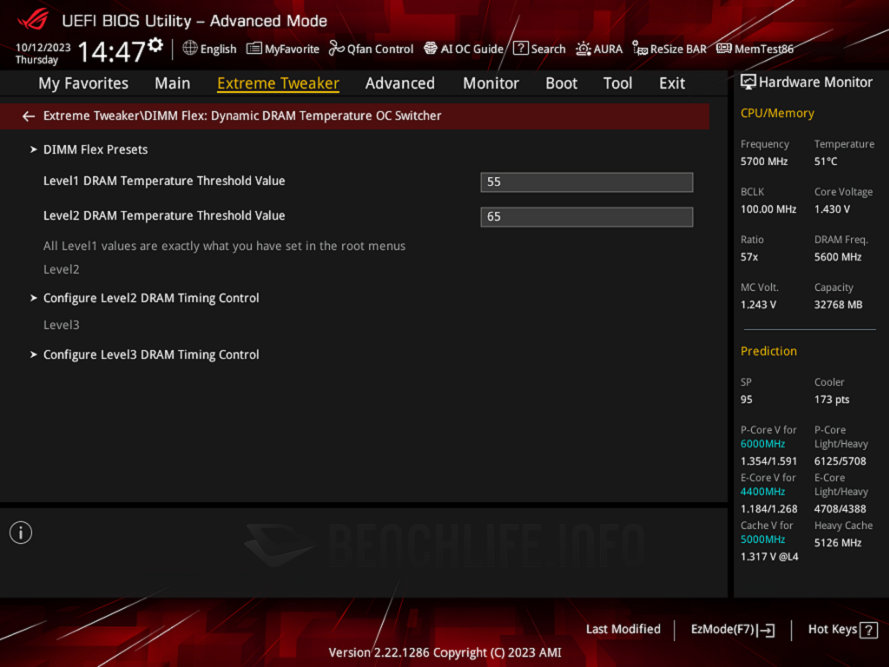
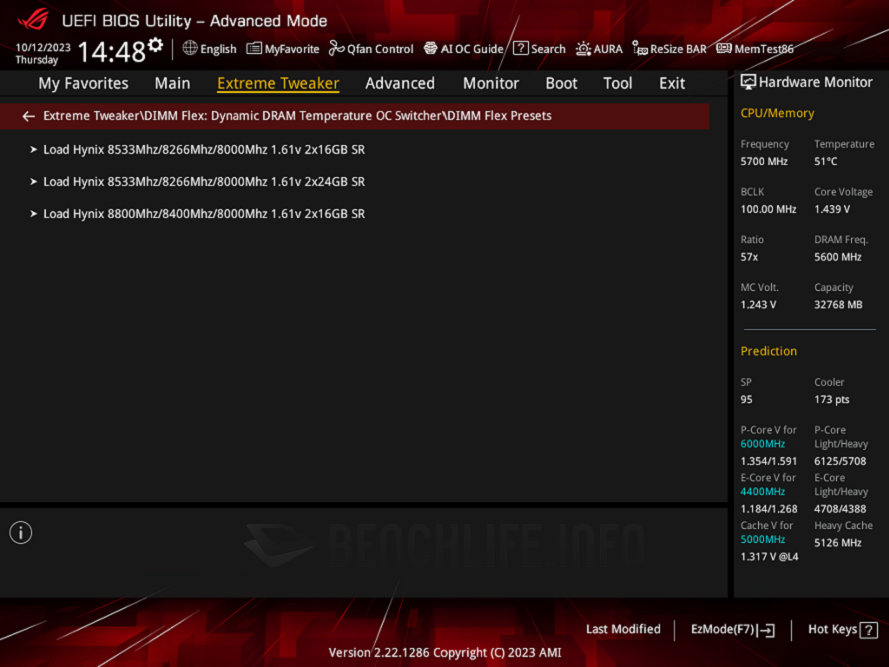
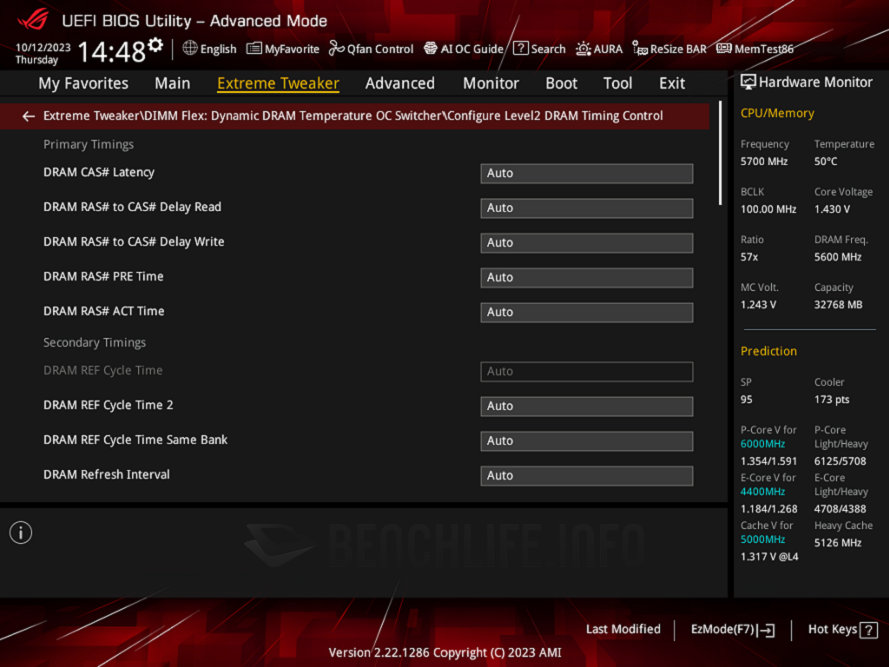
繼續就 ASUS ROG Maximus Z790 Dark Hero 來看,其 UEBI BIOS 層包含 DIMM Flex 這項新功能,可以針對記憶體超頻進行溫度監控與自訂標的,預設還提供 SK Hynix 顆粒模組試用的 ≥8000MT/s 超頻組態。
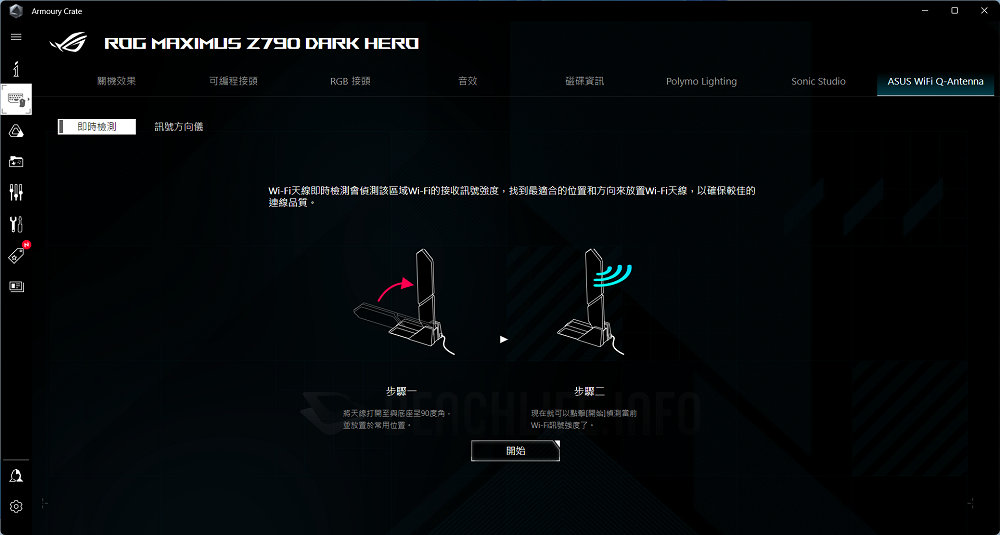
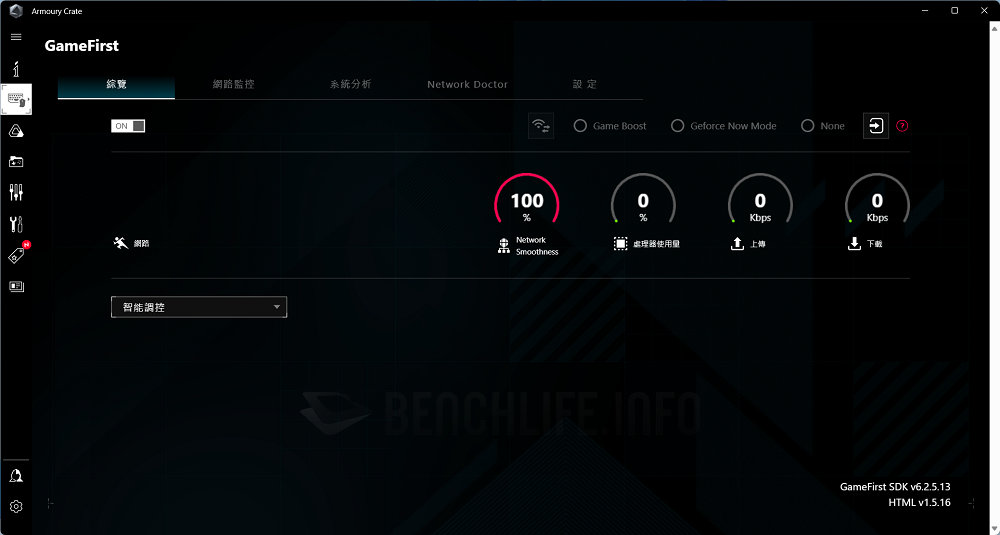
軟體層在 Armoury Crate 新增 ASUS Wi-Fi Q-Antenna 功能,可以透過 Wi-Fi 訊號強度檢測 / 方向儀,找出天線較合適的擺放位置與方向,此外網路相關軟體 GameFirst 也直接整合進 Armoury Crate。
性能實測體驗與比較
性能實測使用主機板 ASUS ROG Maximus Z790 Dark Hero(BIOS:0502),我們讓 UEFI BIOS 維持在預設值,僅將 ASUS MultiCore Enhancement 選項調整為關閉,使處理器倍頻與 Power Limit 以 Intel 預設值,而非 ASUS 最佳化的組態來運作(預設 Auto 會將 PL2 放寬至 4,095W)。
測試平台
- 處理器:Intel Core i9-14900K、Core i9-13900K、Core i5-14600K、Core i5-13600K
- 主機板:ASUS ROG Maximus Z790 Dark Hero
- 記憶體:Crucial DDR5 Pro DDR5-5600 32GB Kit(CP2K16G56C46U5)
- 系統碟:Western Digital WD_BLACK SN850 1TB
- 顯示卡:NVIDIA GeForce RTX 4090 Founders Edition
- 電源供應器:ASUS ROG Thor II 1000W
- 散熱器:Noctua NH-D15S
- 顯示器:ASUS TUF Gaming VG28UQL1A
- 作業系統:Microsoft Windows 11 Pro 64bit 22H2
在邏輯上應該是 Raptor Lake-S Refresh 的表現勝出,但主機板各自最佳化設定、散熱器解熱性能、環境溫度等諸多因素,都會左右新、舊世代同級產品的測試結果,那些微時脈差異未必能保證勝出,性能實測體驗足以證明。
基於這樣的但書或說原由,下列數據似乎也無須多做分析,Core i9-14900K 對上 Core i9-13900K、Core i5-14600K 和 Core i5-13600K 新品表現很合理會稍好,但如果出現稍微落後之處也不用感到意外,這是真實使用可能遇到的狀況。
| 運算性能類測試 | Core i9-14900K | Core i9-13900K | ± | |
|---|---|---|---|---|
| Sandra | ||||
| 算數處理器 - 總計功效 | MT + MC(GOPS) | 740.9 | 724.15 | 2.31 |
| 1T(GOPS) | 24.52 | 24.23 | 1.20 | |
| 多媒體處理器 - 總計功效 | MT + MC(GPixel/s) | 2.49 | 2.45 | 1.63 |
| 1T(MPixel/s) | 59.76 | 58.4 | 2.33 | |
| 加密解密處理器 - 密碼學頻寬 | MT + MC(GB/s) | 42.16 | 41.54 | 1.49 |
| 1T(GB/s) | 3.37 | 3.31 | 1.81 | |
| 財務分析 - 總期權定價的性能 | MT + MC(kOPT/s) | 255.88 | 255.7 | 0.07 |
| 1T(kOPT/s) | 8.79 | 8.61 | 2.09 | |
| 的科學分析 - 科學的績效匯總 | MT + MC(GFLOPS) | 109.14 | 108.71 | 0.40 |
| 1T(GFLOPS) | 8.42 | 7.59 | 10.94 | |
| 處理器神經網路(AI/ML) - 神經網路聚合性能 | MT + MC(採樣/秒) | 59.28 | 58.65 | 1.07 |
| 1T(採樣/秒) | 1.63 | 1.62 | 0.62 | |
| 影像處理 - 圖像處理的總速率 | MT + MC(GPixel/s) | 1.56 | 1.55 | 0.65 |
| 1T(MPixel/s) | 46.52 | 45.48 | 2.29 | |
| Geekbench 6 | ||||
| Multi-Core Performance | Multi-Core Score | 20933 | 20452 | 2.35 |
| Integer Socre | 19180 | 18756 | 2.26 | |
| Floating Point Socre | 24626 | 24018 | 2.53 | |
| Single-Core Performance | Single-Core Score | 3141 | 3015 | 4.18 |
| Integer Socre | 3047 | 2919 | 4.39 | |
| Floating Point Socre | 3323 | 3201 | 3.81 | |
| 3D Particle Movement | ||||
| Total Score (Mops/sec) | 6063.925 | 6023.47 | 0.67 | |
| 3DTrig (Mops/sec) | 992.2971 | 988.9011 | 0.34 | |
| BiPy (Mops/sec) | 2132.1853 | 2067.2153 | 3.14 | |
| P1rRjct (Mops/sec) | 1272.6261 | 1287.5038 | -1.16 | |
| Cosine (Mops/sec) | 514.0196 | 518.2162 | -0.81 | |
| HypCube (Mops/sec) | 720.8779 | 732.9833 | -1.65 | |
| NormDev (Mops/sec) | 431.9196 | 428.6499 | 0.76 | |
| y-cruncher | ||||
| Multi-Core | Total Computation Time(Sec) | 22.171 | 22.532 | 1.63 |
| Start-to End Wall Time(Sec) | 22.297 | 23.291 | 4.46 | |
| Single-Core | Total Computation Time(Sec) | 193.165 | 197.288 | 2.13 |
| Start-to End Wall Time(Sec) | 194.649 | 198.836 | 2.15 | |
| Dolphin | ||||
| Overall time(Sec) | 164 | 169 | 3.05 | |
| Time spent on meteor-contest(Sec) | 31 | 33 | 6.45 | |
| Time spent on n-body(Sec) | 37 | 39 | 5.41 | |
| Time spent on pi-digits(Sec) | 45 | 45 | 0.00 | |
| Time spent on spectral-norm(Sec) | 23 | 24 | 4.35 | |
| 7-Zip | ||||
| Compressing(GIPS) | 166.746 | 163.839 | 1.77 | |
| Decompressing(GIPS) | 220.387 | 217.9 | 1.14 | |
| Total Ratin(GIPS) | 193.716 | 190.87 | 1.49 | |
| WinRAR | ||||
| Benchmark(KB/s) | 50222 | 49026 | 2.44 | |
| AIDA64 Cache & Memory Benchmark | ||||
| DDR5-5600 | Read(MB/s) | 88210 | 85586 | 3.07 |
| Write(MB/s) | 77861 | 77241 | 0.80 | |
| Copy(MB/s) | 78897 | 77414 | 1.92 | |
| Leatency(ns) | 82.1 | 82.8 | 0.85 | |
| Sandra | ||||
| 記憶體頻寬 | 總體記憶體性能(GB/s) | 68.85 | 68.17 | 1.00 |
| 整數記憶體頻寬 B/F AVX2/256(GB/s) | 68.39 | 67.16 | 1.83 | |
| 浮點數記憶體頻寬 B/F FMA/256(GB/s) | 69.3 | 69.2 | 0.14 | |
| Core i9-14900K | Core i9-13900K | ± | ||
| 運算性能類測試 | Core i5-14600K | Core i5-13600K | ± | |
|---|---|---|---|---|
| Sandra | ||||
| 算數處理器 - 總計功效 | MT + MC(GOPS) | 484.88 | 456.86 | 6.13 |
| 1T(GOPS) | 23.6 | 21.56 | 9.46 | |
| 多媒體處理器 - 總計功效 | MT + MC(GPixel/s) | 1.55 | 1.52 | 1.97 |
| 1T(MPixel/s) | 54 | 53 | 1.89 | |
| 加密解密處理器 - 密碼學頻寬 | MT + MC(GB/s) | 30.86 | 30.09 | 2.56 |
| 1T(GB/s) | 3.14 | 3.1 | 1.29 | |
| 財務分析 - 總期權定價的性能 | MT + MC(kOPT/s) | 158.83 | 156.4 | 1.55 |
| 1T(kOPT/s) | 8 | 7.81 | 2.43 | |
| 的科學分析 - 科學的績效匯總 | MT + MC(GFLOPS) | 86.16 | 83.25 | 3.50 |
| 1T(GFLOPS) | 7.55 | 7.42 | 1.75 | |
| 處理器神經網路(AI/ML) - 神經網路聚合性能 | MT + MC(採樣/秒) | 43.93 | 41.42 | 6.06 |
| 1T(採樣/秒) | 1.45 | 1.35 | 7.41 | |
| 影像處理 - 圖像處理的總速率 | MT + MC(MPixel/s) | 997.14 | 960.46 | 3.82 |
| 1T(MPixel/s) | 42.14 | 41.22 | 2.23 | |
| Geekbench 6 | ||||
| Multi-Core Performance | Multi-Core Score | 17051 | 16582 | 2.83 |
| Integer Socre | 15612 | 15149 | 3.06 | |
| Floating Point Socre | 20086 | 19613 | 2.41 | |
| Single-Core Performance | Single-Core Score | 2793 | 2707 | 3.18 |
| Integer Socre | 2714 | 2625 | 3.39 | |
| Floating Point Socre | 2946 | 2866 | 2.79 | |
| 3D Particle Movement | ||||
| Total Score (Mops/sec) | 3741.08 | 3595.261 | 4.06 | |
| 3DTrig (Mops/sec) | 601.3708 | 580.6307 | 3.57 | |
| BiPy (Mops/sec) | 1345.3811 | 1284.1597 | 4.77 | |
| P1rRjct (Mops/sec) | 792.593 | 760.4235 | 4.23 | |
| Cosine (Mops/sec) | 308.5253 | 299.6265 | 2.97 | |
| HypCube (Mops/sec) | 434.5191 | 417.3849 | 4.11 | |
| NormDev (Mops/sec) | 258.6906 | 253.0362 | 2.23 | |
| y-cruncher | ||||
| Multi-Core | Total Computation Time(Sec) | 27.427 | 27.936 | 1.86 |
| Start-to End Wall Time(Sec) | 28.176 | 28.712 | 1.90 | |
| Single-Core | Total Computation Time(Sec) | 214.326 | 222.074 | 3.62 |
| Start-to End Wall Time(Sec) | 215.901 | 223.708 | 3.62 | |
| Dolphin | ||||
| Overall time(Sec) | 177 | 184 | 3.95 | |
| Time spent on meteor-contest(Sec) | 34 | 35 | 2.94 | |
| Time spent on n-body(Sec) | 41 | 42 | 2.44 | |
| Time spent on pi-digits(Sec) | 48 | 50 | 4.17 | |
| Time spent on spectral-norm(Sec) | 25 | 26 | 4.00 | |
| 7-Zip | ||||
| Compressing(GIPS) | 123.257 | 120.915 | 1.94 | |
| Decompressing(GIPS) | 134.577 | 125.079 | 7.59 | |
| Total Ratin(GIPS) | 128.917 | 122.997 | 4.81 | |
| WinRAR | ||||
| Benchmark(KB/s) | 33881 | 32927 | ||
| AIDA64 Cache & Memory Benchmark | ||||
| DDR5-5600 | Read(MB/s) | 81268 | 80703 | 0.70 |
| Write(MB/s) | 77748 | 77367 | 0.49 | |
| Copy(MB/s) | 76420 | 75256 | 1.55 | |
| Leatency(ns) | 81.3 | 84.1 | 3.44 | |
| Sandra | 65.6 | |||
| 記憶體頻寬 | 總體記憶體性能(GB/s) | 65.6 | 65.37 | 0.35 |
| 整數記憶體頻寬 B/F AVX2/256(GB/s) | 64.72 | 64.67 | 0.08 | |
| 浮點數記憶體頻寬 B/F FMA/256(GB/s) | 66.54 | 66 | 0.82 | |
| Core i5-14600K | Core i5-13600K | ± | ||
| 影音處理類測試(AI) | Core i9-14900K | Core i9-13900K | ± | |
|---|---|---|---|---|
| Nero Score | ||||
| Score | 15292 | 15002 | 1.93 | |
| CPU Score | 3073 | 2864 | 7.30 | |
| AI Tagging | 3520 | 3241 | 8.61 | |
| AVC Decoding & Encoding | 2625 | 2487 | 5.55 | |
| GPU Score - RTX 4090 | 12219 | 12138 | 0.67 | |
| AVC Decoding & Encoding | 5682 | 5655 | 0.48 | |
| Metaverse | 18755 | 18620 | 0.73 | |
| Topaz Video AI Benchmark:4K | ||||
| Artemis 1X(fps) | 8.72 | 8.62 | 1.16 | |
| Iris 1X(fps) | 8.94 | 8.66 | 3.23 | |
| Proteus 1X(fps) | 7.49 | 7.41 | 1.08 | |
| Gaja 1X(fps) | 3.39 | 3.39 | 0.00 | |
| Nyx 1X(fps) | 2.94 | 2.94 | 0.00 | |
| 4X Slowmo | Apollo(fps) | 17.01 | 16.87 | 0.83 |
| APFast(fps) | 21.63 | 22.64 | -4.46 | |
| Chronos(fps) | 7.18 | 7.17 | 0.14 | |
| CHFast(fps) | 12.95 | 13.07 | -0.92 | |
| Topaz Video AI Benchmark:FHD | ||||
| Artemis 1X(fps) | 43.57 | 41.55 | 4.86 | |
| Iris 1X(fps) | 41.1 | 43.83 | -6.23 | |
| Proteus 1X(fps) | 38.13 | 37.83 | 0.79 | |
| Gaja 1X(fps) | 15.91 | 15.93 | -0.13 | |
| Nyx 1X(fps) | 17.72 | 17.76 | -0.23 | |
| 4X Slowmo | Apollo(fps) | 42.89 | 39.56 | 8.42 |
| APFast(fps) | 75.92 | 77.33 | -1.82 | |
| Chronos(fps) | 32.44 | 32.42 | 0.06 | |
| CHFast(fps) | 34.57 | 33.7 | 2.58 | |
| Core i9-14900K | Core i9-13900K | ± | ||
| 影音處理類測試(AI) | Core i5-14600K | Core i5-13600K | ± | |
|---|---|---|---|---|
| Nero Score | ||||
| Score | 14853 | 14756 | 0.66 | |
| CPU Score | 2714 | 2610 | 3.98 | |
| AI Tagging | 2917 | 2836 | 2.86 | |
| AVC Decoding & Encoding | 2510 | 2384 | 5.29 | |
| GPU Score - RTX 4090 | 12139 | 12146 | -0.06 | |
| AVC Decoding & Encoding | 5645 | 5620 | 0.44 | |
| Metaverse | 18633 | 18672 | -0.21 | |
| Topaz Video AI Benchmark:4K | ||||
| Artemis 1X(fps) | 8.78 | 8.43 | 4.15 | |
| Iris 1X(fps) | 8.63 | 8.68 | -0.58 | |
| Proteus 1X(fps) | 7.42 | 7.72 | -3.89 | |
| Gaja 1X(fps) | 3.38 | 3.39 | -0.29 | |
| Nyx 1X(fps) | 2.93 | 2.93 | 0.00 | |
| 4X Slowmo | Apollo(fps) | 16.5 | 16.39 | 0.67 |
| APFast(fps) | 21.89 | 20.56 | 6.47 | |
| Chronos(fps) | 7.15 | 7.11 | 0.56 | |
| CHFast(fps) | 12.33 | 13.08 | -5.73 | |
| Topaz Video AI Benchmark:FHD | ||||
| Artemis 1X(fps) | 43.17 | 43.42 | -0.58 | |
| Iris 1X(fps) | 42.47 | 40.7 | 4.35 | |
| Proteus 1X(fps) | 37.22 | 32.41 | 14.84 | |
| Gaja 1X(fps) | 15.81 | 15.84 | -0.19 | |
| Nyx 1X(fps) | 17.73 | 17.8 | -0.39 | |
| 4X Slowmo | Apollo(fps) | 38.46 | 38.82 | -0.93 |
| APFast(fps) | 74.27 | 77.84 | -4.59 | |
| Chronos(fps) | 32.21 | 32.49 | -0.86 | |
| CHFast(fps) | 33.41 | 32.61 | 2.45 | |
| Core i5-14600K | Core i5-13600K | ± | ||
| 圖形渲染類測試 | Core i9-14900K | Core i9-13900K | ± | |
|---|---|---|---|---|
| Cinebench 2024 | ||||
| GPU - RTX 4090(pts) | 36090 | 35203 | 2.52 | |
| CPU - Multi Core(pts) | 2101 | 2072 | 1.40 | |
| CPU - Single Core(pts) | 134 | 129 | 3.88 | |
| Blender | ||||
| CPU | monster | 248.79923 | 243.918934 | 2.00 |
| junkshop | 156.565451 | 154.288369 | 1.48 | |
| classrom | 117.710569 | 114.602016 | 2.71 | |
| dGPU - RTX 4090 | monster | 6869.084892 | 6865.097602 | 0.06 |
| junkshop | 3252.225761 | 3237.122733 | 0.47 | |
| classrom | 3174.769578 | 3198.119754 | -0.73 | |
| Corona 10 Benchmark | ||||
| Score(rays/s) | 12057143 | 11870285 | 1.57 | |
| Indigo Bench | ||||
| CPU | Bedroom(M samples/s) | 4.028 | 3.932 | 2.44 |
| Supercar(M samples/s) | 11.897 | 11.655 | 2.08 | |
| dGPU - RTX 4090 | Bedroom(M samples/s) | 35.267 | 35.286 | -0.05 |
| Supercar(M samples/s) | 77.735 | 76.101 | 2.15 | |
| POV-Ray | ||||
| All CPU's(pps) | 12465.83 | 12381.64 | 0.68 | |
| One CPU(pps) | 862.04 | 831.75 | 3.64 | |
| Core i9-14900K | Core i9-13900K | ± | ||
| 圖形渲染類測試 | Core i5-14600K | Core i5-13600K | ± | |
|---|---|---|---|---|
| Cinebench 2024 | ||||
| GPU - RTX 4090(pts) | 35346 | 33984 | 4.01 | |
| CPU - Multi Core(pts) | 1337 | 1311 | 1.98 | |
| CPU - Single Core(pts) | 119 | 116 | 2.59 | |
| Blender | ||||
| CPU | monster | 151.207747 | 147.825645 | 2.29 |
| junkshop | 96.470366 | 94.290822 | 2.31 | |
| classrom | 73.438193 | 71.456283 | 2.77 | |
| dGPU - RTX 4090 | monster | 6877.909574 | 6836.339654 | 0.61 |
| junkshop | 3248.577609 | 3242.181593 | 0.20 | |
| classrom | 3194.130783 | 3180.698977 | 0.42 | |
| Corona 10 Benchmark | ||||
| Score(rays/s) | 7592414 | 7364506 | 3.09 | |
| Indigo Bench | ||||
| CPU | Bedroom(M samples/s) | 2.516 | 2.434 | 3.37 |
| Supercar(M samples/s) | 7.184 | 6.907 | 4.01 | |
| dGPU - RTX 4090 | Bedroom(M samples/s) | 35.155 | 35.127 | 0.08 |
| Supercar(M samples/s) | 77.557 | 77.308 | 0.32 | |
| POV-Ray | ||||
| All CPU's(pps) | 8177.94 | 7824.73 | 4.51 | |
| One CPU(pps) | 772.36 | 746.29 | 3.49 | |
| Core i5-14600K | Core i5-13600K | ± | ||
| 綜合生產力測試 | Core i9-14900K | Core i9-13900K | ± | |
|---|---|---|---|---|
| CrossMark | ||||
| Overall Score | 2676 | 2545 | 5.15 | |
| Productivity | 2511 | 2378 | 5.59 | |
| Creativity | 2831 | 2717 | 4.20 | |
| Responsiveness | 2739 | 2562 | 6.91 | |
| WebXPRT 4 | ||||
| Score | 376 | 368 | 2.17 | |
| Photo Enhancement(ms) | 221 | 224 | 1.36 | |
| Organize Album using AI(ms) | 1003 | 1029 | 2.59 | |
| Stock Option Pricing(ms) | 58 | 59 | 1.72 | |
| Encrypt Notes and OCR Scan(ms) | 619 | 636 | 2.75 | |
| Sales Graphs(ms) | 154 | 156 | 1.30 | |
| Online Homework(ms) | 1128 | 1173 | 3.99 | |
| PCMark 10 Extended | ||||
| Score | 14880 | 14362 | 3.61 | |
| Essentials | Score | 12750 | 12397 | 2.85 |
| App Start-up Score | 20795 | 19420 | 7.08 | |
| Video Conferencing Score | 8380 | 8375 | 0.06 | |
| Web Browsing Score | 11895 | 11717 | 1.52 | |
| Productivity | Score | 13532 | 13016 | 3.96 |
| Spreadsheets Score | 17665 | 17004 | 3.89 | |
| Writing Score | 10367 | 9964 | 4.04 | |
| Digital Content Creation | Score | 18723 | 18354 | 2.01 |
| Photo Editing Score | 25785 | 26084 | -1.15 | |
| Rendering and Visualization Score | 26937 | 26834 | 0.38 | |
| Video Editing Score | 9450 | 8834 | 6.97 | |
| Gaming | Score | 41007 | 38814 | 5.65 |
| Graphics score | 67086 | 62959 | 6.56 | |
| Physics score | 55525 | 54238 | 2.37 | |
| Combined score | 15489 | 14687 | 5.46 | |
| Procyon Office Productivity | ||||
| Office Productivity score | 9152 | 9023 | 1.43 | |
| Office Productivity MP score | 302000 | 299000 | 1.00 | |
| Word socre | 8657 | 9167 | -5.56 | |
| Excel socre | 9206 | 8921 | 3.19 | |
| PowerPoint socre | 9643 | 9258 | 4.16 | |
| Outlook score | 9109 | 8499 | 7.18 | |
| Word MP socre | 362000 | 381000 | -4.99 | |
| Excel MP socre | 221000 | 214000 | 3.27 | |
| PowerPoint MP socre | 346000 | 330000 | 4.85 | |
| Procyon Photo Editing Benchmark | ||||
| Photo Editing Benchmark score | 10918 | 10671 | 2.31 | |
| Image Retouching score | 9748 | 11752 | -17.05 | |
| Batch Processing score | 12229 | 9691 | 26.19 | |
| Procyon Video Editing | ||||
| Video Editing score | 10420 | 10203 | 2.13 | |
| Core i9-14900K | Core i9-13900K | ± | ||
| 綜合生產力測試 | Core i5-14600K | Core i5-13600K | ± | |
|---|---|---|---|---|
| CrossMark | ||||
| Overall Score | 2323 | 2313 | 0.43 | |
| Productivity | 2213 | 2187 | 1.19 | |
| Creativity | 2417 | 2445 | -1.15 | |
| Responsiveness | 2386 | 2319 | 2.89 | |
| WebXPRT 4 | ||||
| Score | 349 | 340 | 2.65 | |
| Photo Enhancement(ms) | 231 | 237 | 2.60 | |
| Organize Album using AI(ms) | 1081 | 1118 | 3.42 | |
| Stock Option Pricing(ms) | 62 | 63 | 1.61 | |
| Encrypt Notes and OCR Scan(ms) | 671 | 697 | 3.87 | |
| Sales Graphs(ms) | 162 | 166 | 2.47 | |
| Online Homework(ms) | 1274 | 1298 | 1.88 | |
| PCMark 10 Extended | ||||
| Score | 14164 | 13900 | 1.90 | |
| Essentials | Score | 11851 | 11599 | 2.17 |
| App Start-up Score | 19019 | 18175 | 4.64 | |
| Video Conferencing Score | 7698 | 7642 | 0.73 | |
| Web Browsing Score | 11369 | 11238 | 1.17 | |
| Productivity | Score | 12553 | 12097 | 3.77 |
| Spreadsheets Score | 16256 | 15740 | 3.28 | |
| Writing Score | 9695 | 9298 | 4.27 | |
| Digital Content Creation | Score | 16779 | 16797 | -0.11 |
| Photo Editing Score | 22740 | 23824 | -4.55 | |
| Rendering and Visualization Score | 24074 | 23503 | 2.43 | |
| Video Editing Score | 8630 | 8465 | 1.95 | |
| Gaming | Score | 43562 | 42797 | 1.79 |
| Graphics score | 85167 | 84210 | 1.14 | |
| Physics score | 38138 | 36841 | 3.52 | |
| Combined score | 15612 | 15363 | 1.62 | |
| Procyon Office Productivity | ||||
| Office Productivity score | 8520 | 8338 | 2.18 | |
| Office Productivity MP score | 282000 | 275000 | 2.55 | |
| Word socre | 8485 | 8334 | 1.81 | |
| Excel socre | 8267 | 8148 | 1.46 | |
| PowerPoint socre | 8934 | 8719 | 2.47 | |
| Outlook score | 8302 | 7998 | 3.80 | |
| Word MP socre | 355000 | 345000 | 2.90 | |
| Excel MP socre | 197000 | 195000 | 1.03 | |
| PowerPoint MP socre | 321000 | 312000 | 2.88 | |
| Procyon Photo Editing Benchmark | ||||
| Photo Editing Benchmark score | 10046 | 9729 | 3.26 | |
| Image Retouching score | 10749 | 10501 | 2.36 | |
| Batch Processing score | 9390 | 9015 | 4.16 | |
| Procyon Video Editing | ||||
| Video Editing score | 9678 | 9498 | 1.90 | |
| Core i5-14600K | Core i5-13600K | ± | ||
| 3DMark 測試 | Core i9-14900K | Core i9-13900K | ± | |
|---|---|---|---|---|
| Speed Way Score | Score | 10105 | 10103 | 0.02 |
| Port Royal | Score | 25893 | 25881 | 0.05 |
| Time Spy Extreme | Score | 18214 | 18142 | 0.40 |
| Graphics score | 19496 | 19460 | 0.18 | |
| CPU score | 13270 | 13111 | 1.21 | |
| Time Spy | Score | 33716 | 33569 | 0.44 |
| Graphics score | 37300 | 37259 | 0.11 | |
| CPU score | 21830 | 21502 | 1.53 | |
| Fire Strike Ultra | Score | 24402 | 24168 | 0.97 |
| Graphics score | 24021 | 24008 | 0.05 | |
| Physics score | 55651 | 54343 | 2.41 | |
| Combined socre | 14162 | 13558 | 4.45 | |
| Fire Strike Extreme | Score | 38576 | 37660 | 2.43 |
| Graphics score | 44202 | 44171 | 0.07 | |
| Physics score | 55856 | 54151 | 3.15 | |
| Combined socre | 15950 | 14698 | 8.52 | |
| Fire Strike | Score | 47552 | 47416 | 0.29 |
| Graphics score | 63290 | 64817 | -2.36 | |
| Physics score | 55726 | 54174 | 2.86 | |
| Combined socre | 15414 | 14815 | 4.04 | |
| CPU Profile | Max threads | 16829 | 16646 | 1.10 |
| 16-threads | 12018 | 11677 | 2.92 | |
| 8-threads | 9103 | 8776 | 3.73 | |
| 4-threads | 4849 | 4684 | 3.52 | |
| 2-threads | 2451 | 2361 | 3.81 | |
| 1-threads | 1259 | 1199 | 5.00 | |
| Core i9-14900K | Core i9-13900K | ± | ||
| 3DMark 測試 | Core i5-14600K | Core i5-13600K | ± | |
|---|---|---|---|---|
| Speed Way Score | Score | 10066 | 10042 | 0.24 |
| Port Royal | Score | 25971 | 25956 | 0.06 |
| Time Spy Extreme | Score | 16066 | 16060 | 0.04 |
| Graphics score | 19514 | 19552 | -0.19 | |
| CPU score | 8028 | 7983 | 0.56 | |
| Time Spy | Score | 32132 | 32021 | 0.35 |
| Graphics score | 37211 | 37219 | -0.02 | |
| CPU score | 18119 | 17875 | 1.37 | |
| Fire Strike Ultra | Score | 24039 | 23964 | 0.31 |
| Graphics score | 24388 | 24307 | 0.33 | |
| Physics score | 38340 | 39744 | -3.53 | |
| Combined socre | 14406 | 14086 | 2.27 | |
| Fire Strike Extreme | Score | 37551 | 37485 | 0.18 |
| Graphics score | 44990 | 44906 | 0.19 | |
| Physics score | 38434 | 39615 | -2.98 | |
| Combined socre | 16510 | 16158 | 2.18 | |
| Fire Strike | Score | 51063 | 49412 | 3.34 |
| Graphics score | 79193 | 79138 | 0.07 | |
| Physics score | 38189 | 38377 | -0.49 | |
| Combined socre | 16168 | 14594 | 10.79 | |
| CPU Profile | Max threads | 10668 | 10467 | 1.92 |
| 16-threads | 9856 | 9672 | 1.90 | |
| 8-threads | 7461 | 7236 | 3.11 | |
| 4-threads | 4501 | 4349 | 3.50 | |
| 2-threads | 2270 | 2192 | 3.56 | |
| 1-threads | 1129 | 1093 | 3.29 | |
| Core i5-14600K | Core i5-13600K | ± | ||
| 遊戲測試:最高貼圖品質、平均 FPS | Resolution | Core i9-14900K | Core i9-13900K |
|---|---|---|---|
| Ashes of the Singularity: Escalation | 4K | 150.6 | 150.3 |
| FHD | 159.1 | 154.4 | |
| Call of Duty - Modern Warfare II | 4K | 143 | 141 |
| FHD | 256 | 254 | |
| Cyberpunk 2077 | 4K | 82.43 | 81.85 |
| FHD | 208.73 | 203.9 | |
| Dirt 5 | 4K | 187 | 186.2 |
| FHD | 294.5 | 289 | |
| F1 22 | 4K | 227 | 226 |
| FHD | 391 | 390 | |
| FarCry 6 | 4K | 141 | 140 |
| FHD | 192 | 183 | |
| Forza Horizon 5 | 4K | 154 | 154 |
| FHD | 213 | 209 | |
| Gears Tactics | 4K | 177.7 | 175.06 |
| FHD | 328.1 | 319.3 | |
| Immortals Fenyx Rising | 4K | 123 | 123 |
| FHD | 181 | 181 | |
| Tom Clancy's Rainbow Six Extraction | 4K | 205 | 203 |
| FHD | 270 | 262 | |
| World Of Tanks enCORE Benchmark(Score) | 4K | 52533 | 52530 |
| FHD | 120405 | 118339 | |
| Core i9-14900K | Core i9-13900K |
| 遊戲測試:最高貼圖品質、平均 FPS | Resolution | Core i5-14600K | Core i5-13600K |
|---|---|---|---|
| Ashes of the Singularity: Escalation | 4K | 146 | 141.1 |
| FHD | 149 | 148.9 | |
| Call of Duty - Modern Warfare II | 4K | 143 | 141 |
| FHD | 250 | 247 | |
| Cyberpunk 2077 | 4K | 81.42 | 81.09 |
| FHD | 191.4 | 186.83 | |
| Dirt 5 | 4K | 186.1 | 185.9 |
| FHD | 286.4 | 282 | |
| F1 22 | 4K | 227 | 224 |
| FHD | 353 | 341 | |
| FarCry 6 | 4K | 138 | 136 |
| FHD | 167 | 165 | |
| Forza Horizon 5 | 4K | 154 | 153 |
| FHD | 202 | 202 | |
| Gears Tactics | 4K | 171.9 | 166.8 |
| FHD | 242.9 | 235.6 | |
| Immortals Fenyx Rising | 4K | 123 | 122 |
| FHD | 179 | 179 | |
| Tom Clancy's Rainbow Six Extraction | 4K | 203 | 200 |
| FHD | 242 | 239 | |
| World Of Tanks enCORE Benchmark(Score) | 4K | 52259 | 52119 |
| FHD | 118192 | 112864 | |
| Core i5-14600K | Core i5-13600K |
總和而言,第 14 代 Intel Core 桌上型處理器(Raptor Lake-S Refresh),不諱言只是第 13 代(Raptor Lake-S)的時脈微調、再最佳化版本,它夠不夠格稱之為第 14 代,見仁見智吧。
儘管 Intel 著力處並未侷限在硬體,他們試圖從韌、軟體層導入新機能,使性能發揮與使用體驗能更精進。只不過殘酷的現實如前述,一些新功能可能由 Core i9-14900K / KF 獨享,使得這代微更新的吸引力被稀釋。
你覺得如何呢?
Intel 700 系列晶片主機板開箱
- 換上 Wi-Fi 7 無線網路模組再出發,MSI MPG Z790 Edge Ti Max WiFi 開箱
- 配備 Wi-Fi 7、M.2 支援 PCIe 5.0,ASUS ROG Maximus Z790 Dark Hero 開箱
- 中階的 Intel Z790 晶片主機板,ASUS TUF Gaming Z790-PRO WIFI 開箱
- 旗艦級的 Intel Z790 晶片主機板,GIGABYTE Z790 AORUS XTREME X 開箱
- 針對 Intel Raptor Lake Refresh 最佳化,MSI MEG Z790 Ace Max 開箱
- 次旗艦級別的 Intel Z790 晶片主機板,GIGABYTE Z790 AORUS MASTER X 開箱介紹
- 開始為 Raptor Lake-S Refresh 做準備,GIGABYTE Z790 AORUS PRO X 主機板預覽
Intel 14th Gen 系列處理器實測
- Intel Core i9-14900K、Core i5-14600K 搭 ASUS ROG Maximus Z790 Dark Hero 實測
- 水空冷混合式 VRM 散熱方案回歸,ASUS ROG Maximus Z790 Formula 主機板實測
- 挑戰 DDR5-8000 MT/s 以上的 4 記憶體插槽主機板,GIGABYTE Z790 AORUS XTREME X 實測
- 搭配 GIGABYTE Z790 AORUS MASTER X 主機板,Intel Core i9-14900K、Core i7-14700K 與 Core i5-14600K 等 8 顆處理器實測